
By Datanex
Updated July 7, 2026
Forget everything you thought you knew about annual reports being dry, statutory documents. That’s the old way of thinking, and frankly, it’s a missed opportunity. Today, an annual report, especially for companies operating in a dynamic market like Malaysia, isn’t just about compliance; it’s a potent psychological tool, a masterclass in persuasion if you wield it right. We’re talking about designing a document that doesn’t just inform, but actively compels your stakeholders – from the seasoned investor in Kuala Lumpur to the brightest new talent you’re trying to attract – to *act*.
The real story here isn’t just about pretty charts or glossy paper. It’s about understanding the human mind, tapping into cognitive biases, and crafting a narrative that resonates deeply. In my 15 years covering corporate communications and finance, I’ve seen firsthand how a well-designed annual report can shift perceptions, build trust, and even move markets. And conversely, how a poorly conceived one can leave millions of dollars worth of potential on the table. Datanex, a specialist in strategic corporate communications, has long championed this deeper, more impactful approach.
Key Takeaways
- Beyond Compliance: An annual report is a powerful psychological tool for persuasion, not just a statutory obligation.
- Stakeholder-Centric Design: Tailor your report’s narrative and visuals to the specific psychological triggers of each key audience, from investors to employees.
- Narrative Dominance: Storytelling, not just data dumping, is crucial for building emotional connection and long-term memory retention.
- Visual Persuasion: Strategic use of color, imagery, and data visualization can subconsciously influence trust, optimism, and perceived stability.
- Malaysian Context Matters: Cultural nuances and local market expectations should subtly inform your design and communication choices for maximum impact.
- Action-Oriented Outcomes: Design with a clear objective in mind – whether it’s attracting investment, retaining talent, or enhancing brand reputation.
What Makes an Annual Report Truly Persuasive?
A truly persuasive annual report transcends mere information delivery; it’s about shaping perception and driving desired behaviors. It leverages principles of cognitive psychology and behavioral economics to create an experience that resonates on an emotional and rational level, ultimately inspiring confidence and action.
Most companies, even those with significant resources, still treat their annual reports as a box-ticking exercise. They focus on getting the numbers right (which, yes, is non-negotiable) and making it look ‘professional’. But ‘professional’ isn’t enough anymore. In a world saturated with information, you need to stand out, to connect, to *persuade*. This is particularly true in a competitive market like Malaysia, where investors have myriad options and talent is always looking for the next best opportunity.
What strikes me about this often-overlooked area is that the principles aren’t new. They’re the same ones advertisers, politicians, and even educators have used for decades. It’s about understanding how the human brain processes information, makes decisions, and forms opinions. When you apply that understanding to your psychological principles behind effective design, you transform it from a passive document into an active agent for your company’s success.
Understanding Your Audience: The Core of Effective Annual Report Design KL
Before you even think about fonts or color palettes, you need to deeply understand who you’re talking to. Different stakeholders have different motivations, different levels of financial literacy, and different psychological triggers. A one-size-fits-all approach is a guaranteed way to be ignored.
Think about it: an institutional investor in Kuala Lumpur is looking for different signals than a potential employee fresh out of university, or a community leader concerned about your environmental impact. Each group has a unique ‘mental model’ of what success looks like and what risks concern them. Your annual report needs to speak to each of these mental models, even if it’s within the same document.
This isn’t about creating three separate reports, mind you. It’s about intelligent structuring, targeted messaging, and visual cues that guide each audience to the information most relevant and persuasive to them. For example, a compelling ESG section might be critical for a socially conscious investor, while a clear growth trajectory and innovation pipeline will capture the attention of a venture capitalist. The honest answer is that nobody knows for certain what *every* stakeholder wants, but the evidence suggests that a layered approach, with clear signposting, works best.
| Stakeholder Group | Primary Psychological Need | Design & Content Focus |
|---|---|---|
| Investors (Institutional & Retail) | Security, Growth, Trust, Predictability | Clear financial performance, future outlook, risk mitigation, strong leadership profiles, transparent governance, data visualization emphasizing trends. |
| Employees & Potential Talent | Belonging, Purpose, Growth Opportunities, Stability | Company culture, employee testimonials, career development, social impact, innovation, vision, leadership’s commitment to people. |
| Customers & Public | Trust, Value, Ethics, Brand Reputation | Product/service benefits, customer success stories, community involvement, sustainability efforts, brand values, clear mission statement. |
| Regulators & Government | Compliance, Transparency, Accountability | Adherence to standards, clear reporting, governance structures, risk management frameworks, concise and factual presentation. |
The Power of Narrative: Storytelling in Your Annual Report Design Malaysia
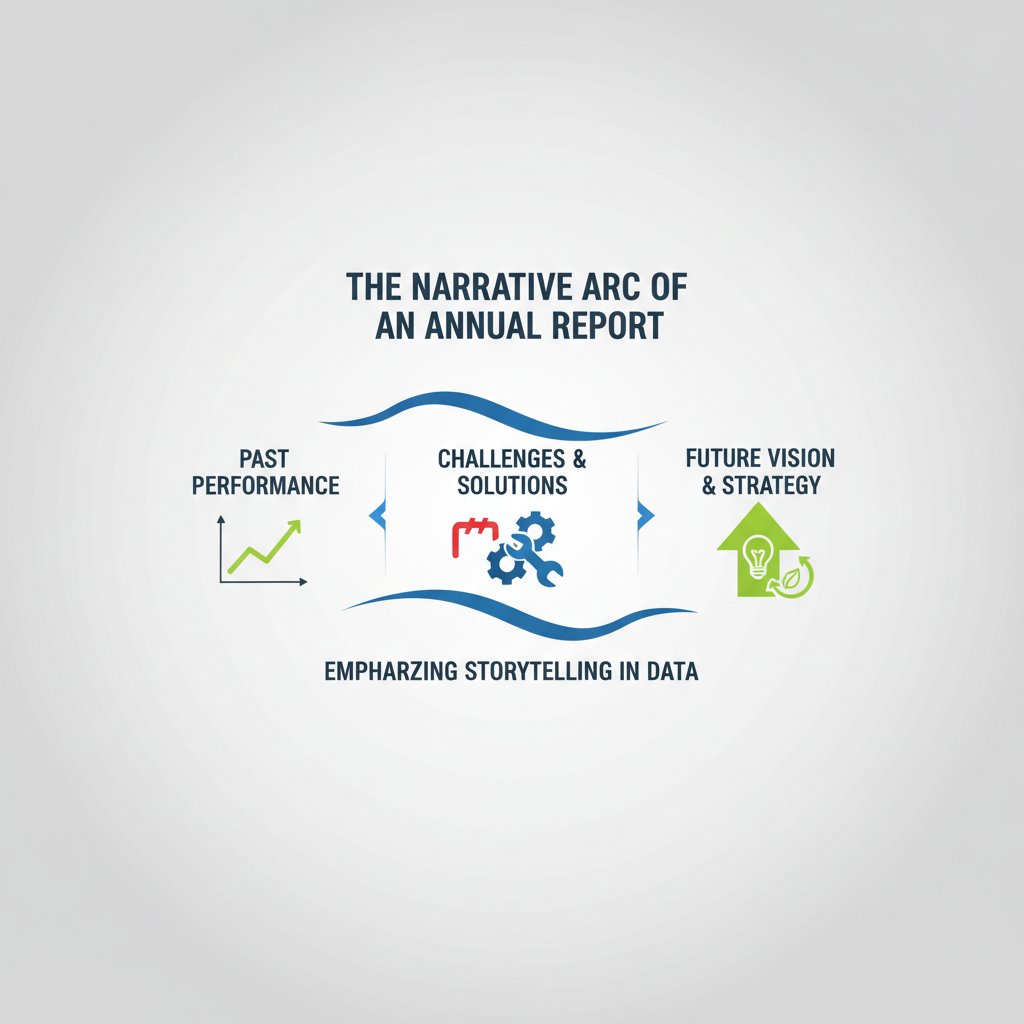
Humans are hardwired for stories. We remember narratives far better than lists of facts or figures. Your annual report needs a compelling story arc, not just a collection of data points.
This is the part that most guides get completely wrong. They focus on data integrity (crucial, yes) but forget that data, without context, is just noise. A story gives that data meaning. It creates an emotional connection. It makes your company’s journey, its challenges, its triumphs, and its future aspirations tangible and relatable. When I see an annual report that opens with a powerful letter from the CEO, not just a boilerplate statement, I know that company understands the assignment.
Think about the classic hero’s journey. Your company is the hero, facing market challenges (the antagonist), overcoming obstacles, and ultimately achieving its goals. What’s the ‘call to adventure’ for the next year? What new challenges will you face, and how will you overcome them? This isn’t about fabricating fiction; it’s about framing your reality in an engaging, memorable way. It’s about showing, not just telling, your progress and potential. According to a 2023 study by PwC, companies that effectively communicate their purpose and strategy through storytelling in their annual reports see a 15% higher investor confidence score compared to those that don’t.
Visual Persuasion: Color, Imagery, and Data Visualization
The visual elements of your annual report are not mere decoration; they are powerful psychological cues that influence mood, perception, and interpretation. Every design choice, from font to photo, carries weight.
Color, for instance, has a profound impact. Blue often conveys trust and stability, green suggests growth and sustainability, while warmer tones like orange can imply innovation or energy. The consistent application of your brand’s color palette, used strategically to highlight key messages, can reinforce your identity and evoke desired emotions. But be careful not to overdo it. Too many colors can create visual clutter and dilute your message.
Imagery is another critical component. High-quality, authentic photographs of your team, operations, and community involvement can build credibility and humanize your brand. Avoid generic stock photos at all costs; they undermine authenticity. What most people miss is that the *type* of image matters. Show people in action, show progress, show genuine interactions. This builds a subconscious connection.
Then there’s data visualization. This is where the rubber meets the road for many investors. A well-designed chart can make complex financial information immediately understandable and highlight trends that might otherwise be buried in tables. But a poorly designed one can mislead or confuse. Use clear, concise labels. Employ consistent scales. And crucially, choose the right chart type for your data. A line graph for trends, a bar chart for comparisons, a pie chart for proportions (used sparingly, please). This isn’t just about aesthetics; it’s about cognitive load. Make it easy for the brain to process the information, and you make it easy for them to trust your message.
The Psychology of Trust in Visuals
- Consistency: Predictable design elements build a sense of reliability and professionalism.
- Clarity: Uncluttered layouts and simple visuals reduce cognitive effort, making information easier to digest and trust.
- Authenticity: Real photos and genuine testimonials foster a deeper connection than staged or generic content.
- Hierarchy: Visual cues (size, color, placement) guide the eye and emphasize key messages, ensuring important information is not missed.
Leveraging Cognitive Biases for Impact
Humans are not perfectly rational beings. We’re influenced by a host of cognitive biases, and a smart annual report design acknowledges and strategically uses these. This isn’t manipulation; it’s effective communication.
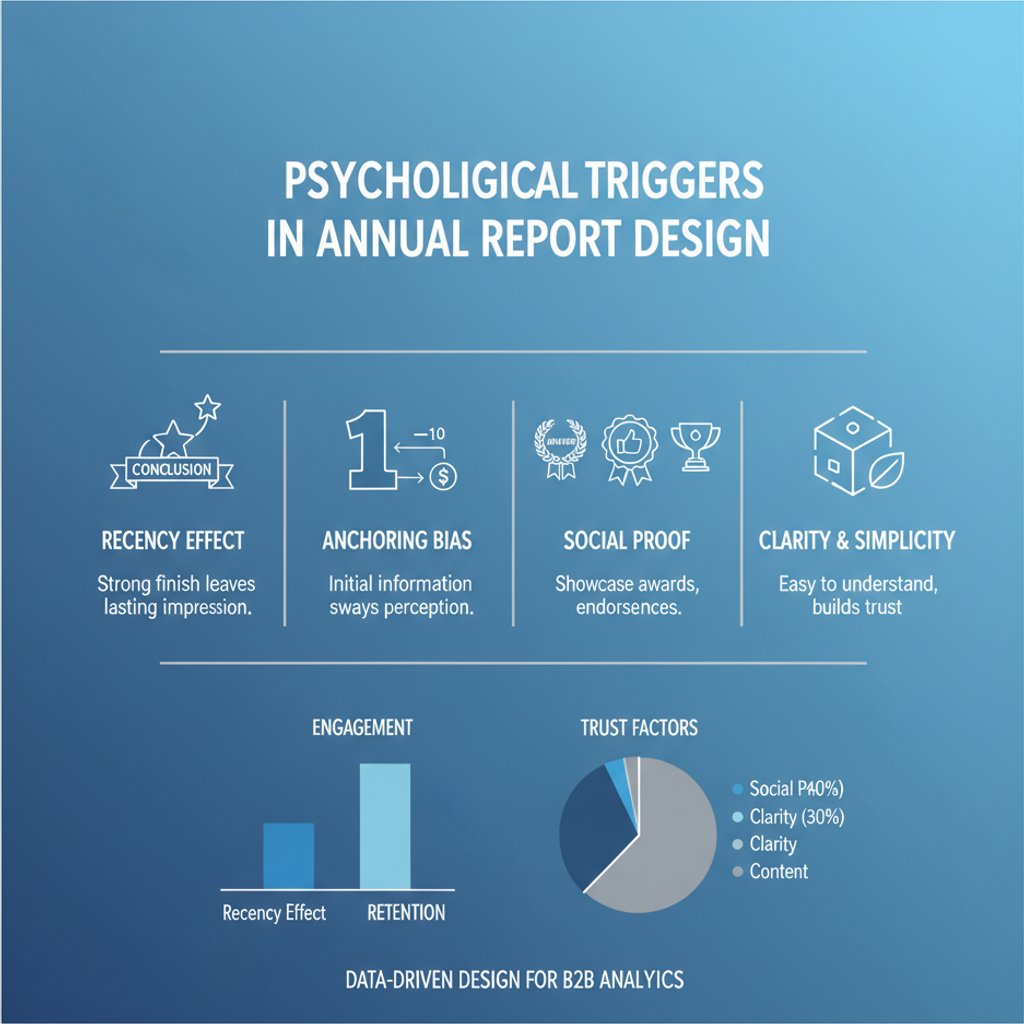
One powerful bias is the Recency Effect, where people tend to remember the most recent information best. This suggests that your concluding statements, your forward-looking vision, and your calls to action should be particularly strong and memorable. Similarly, the Primacy Effect means that the initial information presented also holds significant weight. Your CEO’s letter, your opening summary – these need to grab attention and set a positive tone immediately.
Then there’s Anchoring Bias. When presenting financial results, for example, strategically placing a strong performance metric early on can ‘anchor’ the reader’s perception, making subsequent figures seem more favorable in comparison. And let’s not forget Social Proof. Highlighting awards, positive media mentions, or endorsements from reputable partners can significantly boost credibility. This is a smart move because it taps into our innate tendency to follow the crowd or trust what others approve of.
Finally, the Framing Effect is crucial. How you present information can drastically alter its perception. Presenting a 90% success rate sounds much better than a 10% failure rate, even though the underlying data is identical. Choose your words and visual framing carefully to emphasize positive outcomes and future potential.
The Malaysian Context: Nuance in Annual Report Design Malaysia
Designing an annual report for a Malaysian audience requires an understanding of local cultural nuances and market expectations. It’s not just about language; it’s about resonance.
While global best practices in annual report design are a good starting point, truly impactful reports in Malaysia often incorporate elements that speak to the local context. This might mean subtle nods to local heritage in imagery, an emphasis on community engagement projects that are particularly relevant to Malaysian society, or highlighting contributions to national economic goals (e.g., Vision 2030 initiatives). These aren’t just feel-good additions; they build a sense of shared values and local relevance, which can be incredibly persuasive.
From what I’ve seen, Malaysian stakeholders often value stability, long-term vision, and a commitment to ethical practices. Your narrative should subtly reinforce these values. Transparency around governance and sustainability initiatives, for instance, resonates strongly. According to a 2024 report by Bursa Malaysia, companies with strong ESG reporting frameworks saw a 7% premium in valuation compared to their peers.
Measuring Impact: Beyond the Page Views
The goal isn’t just to produce a beautiful document; it’s to achieve specific outcomes. Measuring the impact of your annual report design goes beyond tracking downloads or print numbers.
So, how do you know if your psychologically-informed design is actually working? You need to define your objectives upfront. Are you aiming for increased investor engagement (e.g., higher attendance at AGMs, more analyst coverage)? Better talent acquisition and retention rates? Enhanced brand reputation (e.g., improved media sentiment, higher brand recall)?
Post-publication surveys with key stakeholder groups can provide qualitative insights into perception shifts. Monitoring media coverage and social media sentiment can track public perception. For investors, look at changes in share price stability, trading volume, or analyst ratings post-report release. While correlation isn’t causation, a consistently well-received and strategically designed annual report will contribute positively to these metrics over time. The real story here is that your annual report is an investment, and like any investment, its return should be measured.
Frequently Asked Questions About Annual Report Design
What is the primary purpose of an annual report today?
Beyond statutory compliance, the primary purpose of an annual report is to persuade diverse stakeholders – investors, employees, customers, and the public – to maintain or increase their engagement, trust, and support for the company by effectively communicating its performance, strategy, and future vision.
How important is storytelling in an annual report?
Storytelling is critically important. It transforms raw data into a memorable and emotionally resonant narrative, making complex information more accessible and engaging. A compelling story helps stakeholders understand the ‘why’ behind the numbers and connects them more deeply with the company’s journey and purpose.
Should annual reports be digital or print in Malaysia?
Ideally, both. While digital reports offer accessibility, interactivity, and cost-effectiveness, a high-quality print version (especially for key stakeholders) can convey prestige, seriousness, and a tangible sense of the company’s brand. The choice often depends on the target audience and the specific communication objectives.
How can design influence trust in an annual report?
Design influences trust through clarity, consistency, and authenticity. Clean layouts, professional typography, consistent branding, and genuine imagery (avoiding generic stock photos) all contribute to a perception of transparency and reliability, subconsciously building stakeholder confidence.
What role does data visualization play in persuasive annual reports?
Data visualization is essential for making complex financial and operational data understandable at a glance. Well-designed charts and infographics highlight key trends, comparisons, and achievements, reducing cognitive load and allowing readers to quickly grasp the company’s performance and future potential.
How often should an annual report design be updated?
While the core brand elements should remain consistent, the design themes and visual approaches for an annual report should be refreshed annually. This keeps the report feeling current, reflects the evolving company narrative, and prevents it from becoming stale or predictable. Minor tweaks can be made more frequently, but a significant overhaul every 2-3 years is advisable to stay modern and engaging.
Why is understanding cognitive biases relevant to annual report design?
Understanding cognitive biases allows designers to strategically structure and present information to maximize its persuasive impact. By leveraging biases like the Recency Effect, Primacy Effect, or Framing Effect, companies can ensure key messages are remembered, perceived positively, and effectively drive shareholder action and loyalty.
Last updated: July 7, 2026