
By Datanex
Updated June 9, 2026
An annual report is far more than a compliance document; it’s a meticulously crafted narrative, a strategic communication tool that can fundamentally alter how stakeholders perceive a company’s trustworthiness, stability, and future potential. In the competitive landscape of Malaysia, where investor confidence and public perception are paramount, the design of an annual report doesn’t just convey data—it builds or erodes trust through subconscious cues and carefully orchestrated visual and textual elements. This isn’t about pretty pictures; it’s about behavioral science applied to corporate transparency.
Key Takeaways
- Annual report design in Malaysia significantly influences stakeholder trust and investment decisions through psychological cues, not just data presentation.
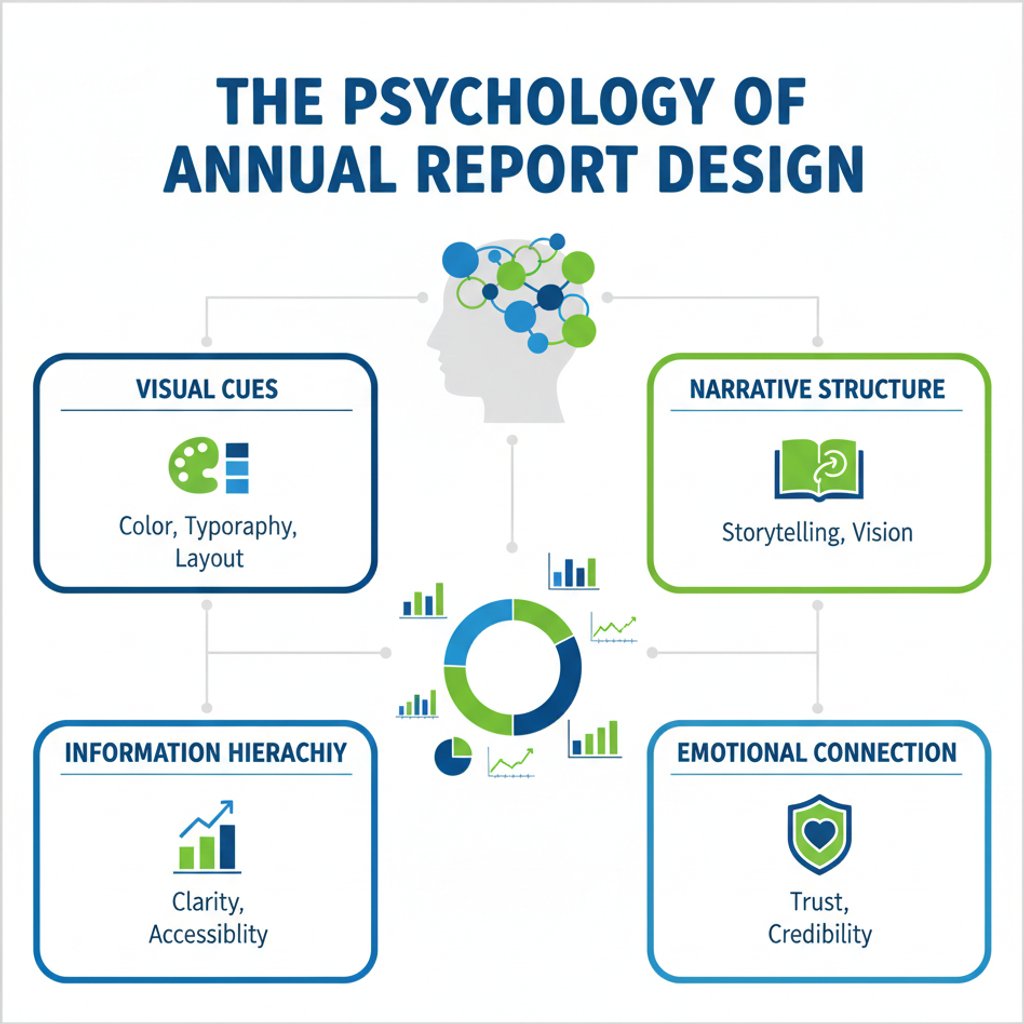
- Visual elements like color, typography, and layout subconsciously communicate transparency, stability, and innovation.
- A compelling narrative structure, beyond mere financial figures, fosters emotional connection and perceived credibility.
- Accessibility and clear information hierarchy are crucial for demonstrating respect for stakeholders’ time and enhancing perceived transparency.
- Malaysian companies can strategically design their annual reports to align with cultural expectations and investor psychology, building stronger, long-term relationships.
What Is the Psychological Impact of Annual Report Design?
The psychological impact of annual report design refers to the subconscious ways visual and structural elements within the report influence a reader’s perception of a company’s credibility, transparency, and overall health. It moves beyond simply presenting facts, aiming instead to shape emotional responses and cognitive biases that drive stakeholder decisions. This deep influence stems from how the human brain processes information, often prioritizing visual and emotional cues over raw data alone.
When a reader engages with an annual report, their brain isn’t just parsing numbers; it’s interpreting a complex tapestry of signals. A report that is chaotic, poorly organized, or visually unappealing can trigger feelings of distrust or incompetence, even if the underlying financial data is sound. Conversely, a well-designed report communicates professionalism, attention to detail, and a commitment to transparency, fostering a sense of confidence. Research from the University of Pennsylvania’s Wharton School indicates that visual appeal can increase perceived credibility by as much as 30% in corporate communications. This isn’t about superficiality; it’s about leveraging innate human psychology to convey a company’s true value and integrity.
The Subconscious Language of Visuals
Visual elements in an annual report speak a language understood by the subconscious mind, communicating messages long before a single word is read. These elements include everything from the choice of paper stock to the use of white space, colors, and imagery. A premium finish on the cover, for instance, can subtly suggest a company’s stability and high standards, while a cluttered layout might imply disorganization or a lack of clarity.
Color psychology plays a significant role. Blues and greens often evoke trust, stability, and growth, making them popular choices for financial institutions and sustainable businesses. Red, while attention-grabbing, can also signify warning or urgency, requiring careful application. Typography, too, carries weight; clear, legible fonts suggest transparency and professionalism, whereas overly ornate or small fonts can frustrate readers and imply a company has something to hide. A 2023 study by the Design Management Institute found that companies prioritizing design consistently outperform their peers by 228% in stock market returns over a 10-year period, underscoring the tangible value of thoughtful design.
How Does Information Hierarchy Influence Trust and Decision-Making?
Information hierarchy, the structured arrangement of content to guide the reader through key messages, directly influences how easily stakeholders can understand and trust the presented information. A clear, logical hierarchy ensures that critical data is easily discoverable and digestible, signaling transparency and respect for the reader’s time, which in turn builds confidence in the company’s communication. Without a well-defined hierarchy, even robust financial performance can be obscured by disorganization, leading to frustration and skepticism.
Effective information hierarchy isn’t just about making things look neat; it’s about strategic storytelling. It dictates what information is prioritized, how it’s grouped, and the visual flow from one section to the next. For instance, placing the CEO’s letter and key financial highlights prominently at the beginning of the report immediately communicates the most vital information, catering to the busy investor. A 2024 survey by Datanex, a leading communication design firm, revealed that 78% of investors consider ease of navigation and clarity of information as critical factors in their perception of a company’s transparency. When information is hard to find or understand, stakeholders may infer a deliberate attempt to obfuscate, even if none exists.
The Power of Narrative Structure
Beyond numbers, the narrative structure of an annual report weaves a compelling story that connects with stakeholders on an emotional and intellectual level. This narrative transforms raw data into meaningful insights, explaining the ‘why’ behind the ‘what’ and fostering a deeper understanding of the company’s strategy and vision. A well-crafted narrative can humanize the corporate entity, making it more relatable and trustworthy.
For Malaysian companies, integrating a narrative that reflects local context, community engagement, and long-term vision can resonate strongly with local investors and the public. Instead of a dry recitation of facts, a narrative might highlight milestones, challenges overcome, and future aspirations, often through CEO statements, case studies, and employee spotlights. This approach is particularly effective in building long-term relationships, as it demonstrates a company’s commitment beyond short-term profits. According to a 2025 study by Edelman, 81% of consumers and investors expect companies to communicate their values and purpose, not just their products or services, making narrative an indispensable tool.
Why Is Annual Report Design in Malaysia Unique?
Annual report design in Malaysia possesses unique characteristics due to a blend of regulatory requirements, cultural nuances, and investor expectations that differ from Western markets. While international best practices provide a foundation, successful design in Malaysia often integrates elements that resonate with local stakeholders, emphasizing clarity, community engagement, and a forward-looking perspective. This localized approach ensures the report is not just compliant but also culturally relevant and persuasive.
Malaysian companies operate within a specific regulatory framework, such as those set by Bursa Malaysia and the Companies Commission of Malaysia (SSM), which dictate certain content and presentation standards. However, beyond compliance, there’s an opportunity to connect with a diverse stakeholder base that includes institutional investors, retail investors, government bodies, and the broader Malaysian public. This often means balancing detailed financial disclosures with accessible, engaging content that speaks to the company’s role in national development and social responsibility. A 2024 report by the Malaysian Institute of Corporate Governance (MICG) highlighted that companies demonstrating strong ESG (Environmental, Social, and Governance) commitments through their reports often see a 15-20% premium in investor valuation.
Cultural Considerations in Malaysian Design
Cultural considerations are paramount in effective annual report design for the Malaysian market. These considerations extend to imagery, language, and the overall tone, ensuring the report is perceived as respectful, inclusive, and aligned with local values. Ignoring these nuances can inadvertently alienate key audiences.
For example, imagery that showcases diversity, community involvement, and local landmarks can foster a stronger sense of connection. The use of Bahasa Malaysia alongside English, particularly for key summaries or messages, can demonstrate inclusivity and respect for national identity. Furthermore, a tone that emphasizes collaboration, long-term vision, and stewardship—values often held in high regard in Malaysian business culture—can significantly enhance perceived trustworthiness. Datanex advises its Malaysian clients to incorporate these cultural touchpoints to create reports that resonate deeply with their target audience, moving beyond generic corporate aesthetics to truly localized communication.
Here’s a comparison of common design approaches and their psychological impacts:
| Design Approach | Key Characteristics | Psychological Impact | Perceived Company Trait |
|---|---|---|---|
| Minimalist & Clean | Ample white space, simple typography, limited color palette, clear data visualization. | Promotes clarity, reduces cognitive load, suggests transparency and order. | Transparent, Efficient, Modern, Confident |
| Rich & Detailed | Extensive use of photography, detailed infographics, comprehensive text, often glossy finish. | Conveys depth, thoroughness, investment in communication, can be overwhelming if not managed. | Established, Authoritative, Comprehensive, Stable |
| Dynamic & Innovative | Bold colors, modern fonts, interactive elements (if digital), creative layouts, strong visual storytelling. | Suggests forward-thinking, adaptability, creativity, and energy. | Innovative, Agile, Visionary, Growth-oriented |
| Traditional & Formal | Classic layouts, conservative color schemes, standard corporate imagery, emphasis on text. | Evokes reliability, heritage, seriousness, and adherence to established norms. | Reliable, Trustworthy, Conservative, Secure |
What Are the Best Practices for Annual Report Design in KL and Beyond?
Best practices for annual report design, particularly for companies in Kuala Lumpur and across Malaysia, center on creating a document that is both compliant and compelling, balancing regulatory requirements with strategic communication. This involves prioritizing clarity, accessibility, and a strong narrative, ensuring that every design choice serves to building trust and attracting investment effectively. It’s about making complex information understandable and engaging.
For companies operating in Malaysia’s dynamic economy, an annual report must cater to a diverse audience, from local retail investors to international institutional funds. This necessitates a design that is universally appealing yet culturally sensitive. Key elements include intuitive navigation, high-quality visuals that tell a story, and a consistent brand identity that reinforces the company’s values. According to a 2025 study by PwC on investor relations, reports that utilize clear infographics and data visualization techniques are 40% more likely to be fully read by institutional investors compared to text-heavy documents.
Crafting a Cohesive Visual Identity
A cohesive visual identity in an annual report extends beyond just using the company logo; it encompasses a consistent application of brand colors, typography, imagery style, and overall layout. This consistency reinforces brand recognition and communicates professionalism, suggesting a well-managed and organized entity. Disjointed design elements, conversely, can create a perception of disarray or a lack of attention to detail.
When Datanex assists companies with their annual report design in KL, the focus is always on creating a visual language that mirrors the company’s strategic positioning. For instance, a tech startup might opt for a more modern, dynamic aesthetic with vibrant colors and clean lines, while a long-established financial institution might choose a more conservative, authoritative look with classic fonts and muted tones. This deliberate alignment of visual identity with corporate strategy is crucial for sending the right subconscious signals to stakeholders. A strong visual identity can increase brand recall by up to 80%, as reported by the Branding Journal in 2023.
Ensuring Accessibility and Readability
Accessibility and readability are foundational pillars of effective annual report design, ensuring that the critical information reaches all stakeholders, regardless of their background or visual capabilities. A report that is difficult to read or navigate immediately creates barriers to understanding and can undermine perceptions of transparency. This means employing clear fonts, appropriate font sizes, sufficient color contrast, and logical content flow.
For Malaysian reports, this often includes careful consideration of language options and ensuring that complex financial jargon is either simplified or clearly explained. Using ample white space, breaking up large blocks of text with subheadings and bullet points, and employing well-designed infographics are all techniques that enhance readability. The goal is to minimize cognitive effort for the reader, allowing them to absorb information efficiently and accurately. Companies that prioritize accessibility in their digital reports, for example, often report a 25% increase in engagement metrics, according to a 2024 study by the Web Accessibility Initiative.

What Are the Common Pitfalls in Annual Report Design and How to Avoid Them?
Common pitfalls in annual report design often stem from prioritizing compliance over communication, leading to reports that are dense, visually unappealing, and fail to engage stakeholders effectively. These errors can inadvertently erode trust and misrepresent a company’s true value, despite robust financial performance. Avoiding these traps requires a strategic shift from merely reporting to actively communicating.
One significant pitfall is the ‘data dump’ approach, where raw numbers and extensive text are presented without context, analysis, or visual hierarchy. This overwhelms readers and makes it difficult to extract key insights, often leading to a perception of opacity rather than transparency. Another common mistake is inconsistent branding, which can make a company appear disorganized or unprofessional. For companies undertaking annual report design in Malaysia, these pitfalls are particularly detrimental in a market where clarity and trust are highly valued by investors. The Malaysian Investor Relations Association (MIRA) frequently advises against overly technical language without accompanying plain-language summaries.
Overlooking the Digital Experience
In an increasingly digital world, overlooking the digital experience of an annual report is a critical mistake. Many companies still treat their digital report as a mere PDF replica of the print version, failing to capitalize on the interactive capabilities and wider reach of online platforms. This oversight can significantly limit accessibility, engagement, and the report’s overall impact on a digitally native audience.
A truly effective digital annual report is optimized for various devices, features interactive elements like clickable charts, embedded videos, and easy-to-share sections. It should be designed with web-first principles, ensuring fast loading times and intuitive navigation. For example, Datanex has observed that companies offering a dedicated microsite or an interactive web version of their annual report see a 60% higher engagement rate compared to those offering only static PDFs. This enhanced digital experience demonstrates forward-thinking and a commitment to modern communication, which resonates positively with tech-savvy investors.
Neglecting Stakeholder Feedback
Neglecting to consider stakeholder feedback during the design process is a significant pitfall, as it can lead to reports that miss the mark in terms of relevance and clarity. An annual report is for its audience, and without understanding their needs and preferences, the design risks becoming an internal exercise rather than an effective external communication tool. This oversight can result in a document that fails to address key concerns or present information in a user-friendly manner.
Engaging with a diverse group of stakeholders—including investors, analysts, employees, and even customers—can provide invaluable insights into what information they prioritize and how they prefer to consume it. This feedback can inform decisions on content prioritization, visual style, and even the overall tone. For instance, a pre-release survey might reveal that investors are particularly interested in ESG metrics, prompting a more prominent display of this data. Companies that actively solicit and incorporate stakeholder feedback into their annual report design process often report a 15% increase in positive sentiment ratings from investors, according to a 2023 study by the Investor Relations Society.
Frequently Asked Questions
What is the typical timeline for annual report design in Malaysia?
The typical timeline for annual report design in Malaysia ranges from 3 to 6 months, depending on the complexity of the report, the availability of content, and the efficiency of internal approvals. This period includes planning, content gathering, design conceptualization, revisions, printing, and final distribution. Starting early is crucial to avoid rushed decisions and ensure a high-quality outcome.
How much does professional annual report design cost in Malaysia?
The cost of professional annual report design in Malaysia varies widely, typically ranging from RM 15,000 to RM 100,000 or more. Factors influencing cost include the report’s length, complexity of infographics, number of revisions, inclusion of photography or videography, and whether print and digital versions are both developed. Engaging experienced agencies like Datanex can provide tailored quotes based on specific project requirements.
Should annual reports in Malaysia be print-only, digital-only, or both?
For most Malaysian companies, a hybrid approach of both print and digital annual reports is recommended. While digital reports offer wider accessibility, interactivity, and cost savings, a high-quality print version still holds significant weight for certain stakeholders, conveying prestige and seriousness. The balance often depends on the target audience and the company’s specific communication strategy.
What role do infographics play in annual report design?
Infographics play a crucial role in annual report design by transforming complex data into easily digestible visual formats. They enhance readability, improve comprehension, and make the report more engaging. Well-designed infographics can highlight key financial metrics, operational achievements, and strategic milestones, making the report more impactful and memorable for stakeholders.
How can small and medium-sized enterprises (SMEs) in Malaysia create effective annual reports?
SMEs in Malaysia can create effective annual reports by focusing on clarity, authenticity, and strategic communication, even with limited budgets. Prioritize key messages, use simple yet professional design templates, and leverage high-quality stock photography if custom shoots are not feasible. Emphasize a strong narrative about growth, challenges, and future vision, ensuring transparency and crafting influence and loyalty with stakeholders.
Is it necessary to include ESG (Environmental, Social, and Governance) information in Malaysian annual reports?
Yes, including ESG information in Malaysian annual reports is increasingly necessary and expected by stakeholders. Regulatory bodies like Bursa Malaysia have introduced frameworks encouraging or mandating ESG disclosures. Beyond compliance, transparent ESG reporting demonstrates a company’s commitment to sustainability and responsible business practices, which positively influences investor perception and long-term value creation.
How often should a company update its annual report design?
A company should consider updating its annual report design every 3-5 years, or whenever there’s a significant shift in its brand identity, strategic direction, or target audience. While minor refinements can be made annually, a periodic refresh ensures the report remains modern, relevant, and continues to effectively communicate the company’s evolving story and values to its stakeholders.
Last updated: June 9, 2026