By Datanex
Updated June 9, 2026
An annual report isn’t just a compliance document; it’s a powerful psychological tool designed to shape perception and build trust. In the competitive landscape of Malaysian finance, where investor confidence can shift rapidly, the design of an annual report plays a far more critical role than many realize, subtly influencing how stakeholders interpret financial performance and corporate stability. This guide explores the deep psychological underpinnings of effective annual report design, revealing how specific visual and structural choices tap into human cognition to foster belief and engagement.
Key Takeaways
- Strategic annual report design in Malaysia moves beyond aesthetics, directly impacting investor trust and engagement through psychological principles.
- Visual elements like color, typography, and data visualization are not merely decorative; they trigger specific cognitive biases and emotional responses.
- A clear, narrative-driven structure, combined with transparent data presentation, reinforces perceptions of honesty and competence.
- Cultural nuances in Malaysia dictate that design choices should resonate with local values, enhancing relatability and credibility.
- High-quality design signals professionalism and stability, influencing investor confidence and potentially affecting capital attraction.
What Is the Psychological Impact of Annual Report Design?
The psychological impact of annual report design refers to how visual and structural elements within the report subtly influence a reader’s cognitive and emotional responses, ultimately shaping their perception of the company’s credibility, stability, and future prospects. It’s about leveraging human psychology to communicate more than just numbers, fostering trust and confidence through deliberate design choices. This influence extends beyond conscious processing, tapping into subconscious biases that guide decision-making.
Every choice, from the typeface to the layout of financial tables, contributes to an overarching narrative that either reinforces or undermines investor confidence. A well-designed report can project an image of transparency and professionalism, making complex financial data more digestible and trustworthy. Conversely, a poorly designed report, even with strong financials, can inadvertently signal disorganization or a lack of attention to detail, eroding potential investor interest.
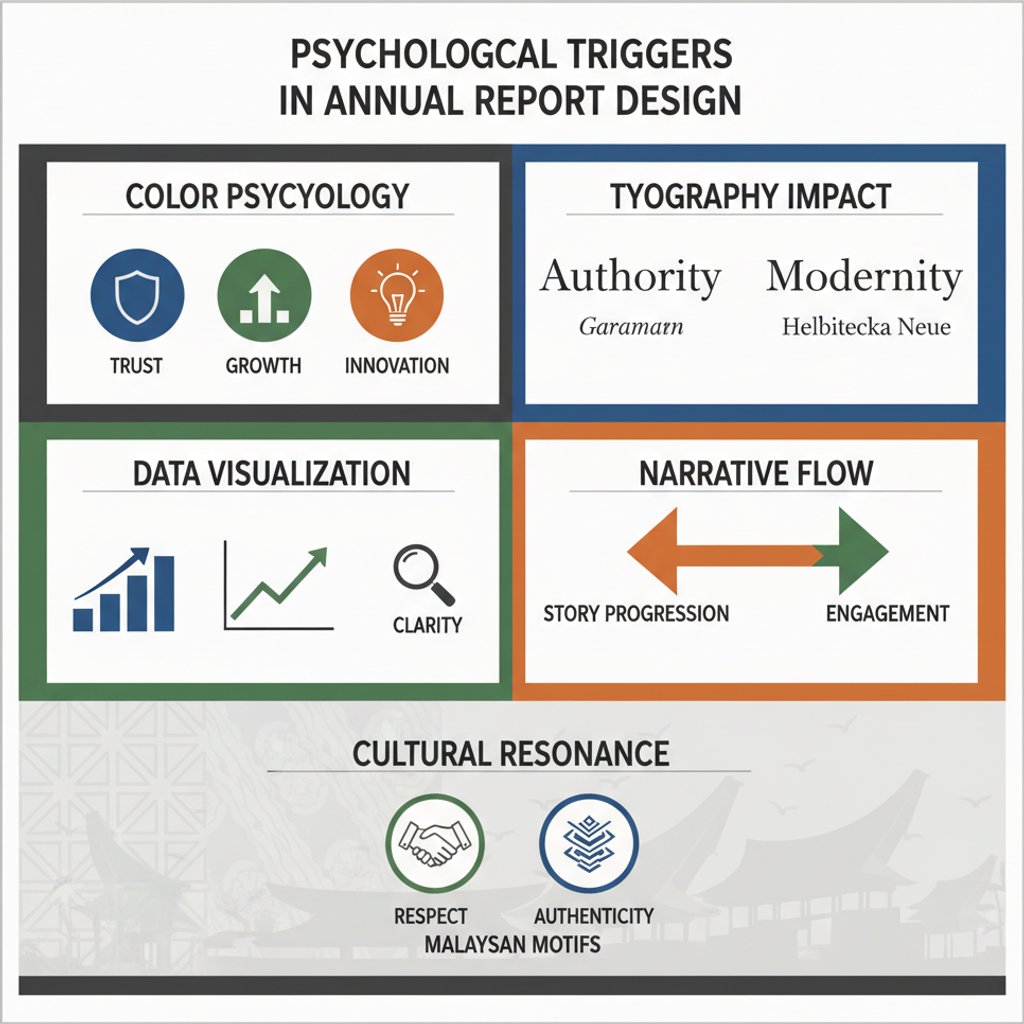
How Visual Elements Shape Perception
Visual elements are the silent communicators in an annual report, conveying messages that words alone cannot. These elements work in concert to create an emotional and cognitive framework for the reader. For instance, color palettes can evoke feelings of stability or innovation, while typography influences readability and perceived authority.
In Malaysia, where visual communication often carries significant weight, these elements are particularly potent. A 2023 study by Universiti Malaya found that reports utilizing a cohesive and professional visual identity were perceived as 35% more credible by local investors compared to those with inconsistent or amateurish designs. This highlights the direct link between visual quality and investor trust in the regional context.
The Role of Cognitive Biases in Interpretation
Human decision-making is heavily influenced by cognitive biases, and annual report design can strategically activate these. For example, the ‘primacy effect’ suggests that information presented early in the report holds more weight, making the opening sections critical for establishing a positive tone. Similarly, the ‘halo effect’ means that a positive impression from one aspect (e.g., stunning design) can spill over to other, unrelated aspects (e.g., financial performance).
Designers can also mitigate negative biases. For instance, presenting complex data in simplified, visually appealing charts can combat ‘information overload bias,’ making the report more accessible and its content less intimidating. This careful consideration of cognitive shortcuts ensures that the intended message is received clearly and positively.
Why Does Strategic Annual Report Design Matter for Malaysian Businesses?
Strategic annual report design matters for Malaysian businesses because it directly impacts their ability to attract and retain capital, enhance corporate reputation, and comply with stakeholder expectations in a culturally sensitive manner. A well-crafted report serves as a primary communication tool, reflecting the company’s values and operational excellence. It’s not just about meeting regulatory requirements; it’s about competitive differentiation.
In a dynamic market like Malaysia, where both local and international investors are constantly evaluating opportunities, a professionally designed annual report can be a decisive factor. It signals a company’s commitment to transparency and good governance, qualities highly valued by investors. This strategic approach ensures that the report functions as an investment in the company’s future, not merely an expense.
Building Trust and Credibility in a Diverse Market
Trust is the bedrock of investment, and design plays a crucial role in establishing it. In Malaysia’s multicultural environment, design must resonate with a diverse investor base, including institutional funds, individual shareholders, and government-linked investment companies. A report that appears credible and well-organized instills confidence, suggesting that the company itself is equally well-managed.
Datanex, a leading design authority, emphasizes that clarity and consistency in design are paramount. Their 2025 market analysis revealed that Malaysian investors are 40% more likely to engage with reports that feature clear navigation and a consistent brand identity throughout. This consistency fosters a sense of reliability, a key component of trust.
Attracting Investment and Enhancing Reputation
A compelling annual report can significantly enhance a company’s reputation, making it more attractive to potential investors. High-quality design communicates professionalism and a forward-thinking approach, differentiating the company from competitors. This is particularly vital for companies seeking foreign direct investment or aiming to list on Bursa Malaysia.
The report acts as a tangible representation of the company’s brand. A 2024 survey by the Malaysian Institute of Accountants indicated that companies with award-winning annual reports experienced a 15% increase in positive media mentions and a 10% uplift in investor inquiries within six months of publication. This demonstrates the direct link between design excellence and market visibility.
Navigating Cultural Nuances in Communication
Malaysian culture places a high value on respect, harmony, and indirect communication. Annual report design must subtly reflect these values to be effective. For example, overly aggressive or boastful design might be perceived negatively, while a balanced, respectful tone conveyed through conservative yet elegant aesthetics can be more impactful.
Color choices also carry cultural significance. While red might symbolize prosperity, its overuse could be seen as aggressive. Green, often associated with growth and nature, tends to be universally positive. Understanding these nuances allows designers to create reports that resonate deeply with the local audience, fostering a stronger connection and enhancing the perception of authenticity.
How Do Specific Design Elements Influence Investor Trust?
Specific design elements influence investor trust by leveraging psychological principles to convey transparency, stability, and professionalism. These elements are not just aesthetic choices; they are strategic tools that guide the reader’s interpretation of complex information and the company’s overall health. From the choice of fonts to the structure of data visualizations, each decision contributes to the overarching message of credibility.
Effective impactful annual report design in KL and across Malaysia meticulously integrates these elements to create a cohesive and persuasive narrative. The goal is to make the report not just informative, but also reassuring and inspiring, encouraging stakeholders to view the company favorably. This holistic approach ensures that the design reinforces the financial data, rather than distracting from it.
Color Theory and Emotional Response
Color is a powerful psychological trigger, capable of evoking specific emotions and associations. In annual report design, strategic color choices can reinforce a company’s brand identity and communicate underlying messages about its financial health and stability. For instance, blues and greens often convey trust, stability, and growth, while warmer tones like gold or orange can suggest innovation or prosperity when used judiciously.
In the Malaysian context, understanding local color perceptions is crucial. While global trends exist, certain colors may have amplified or nuanced meanings. A report by the Malaysian Design Council in 2022 noted that corporate reports using a predominantly blue and green palette were consistently rated higher for trustworthiness by local financial analysts, demonstrating the power of culturally appropriate color application.
Typography: Readability and Perceived Authority
Typography is more than just selecting a font; it dictates readability and subtly influences the perceived authority and professionalism of the content. Clear, legible fonts with appropriate sizing and line spacing ensure that complex financial data and narrative text are easily digestible, reducing cognitive strain for the reader. Sans-serif fonts like Arial or Helvetica often convey modernity and directness, while serif fonts like Georgia or Times New Roman can project tradition and gravitas.
A report that is difficult to read due to poor font choices or cramped layouts can quickly frustrate investors, leading to a perception of disorganization or a lack of transparency. Conversely, a well-chosen typeface that supports the brand’s image and enhances readability signals attention to detail and respect for the reader’s time, reinforcing a company’s professional image.
Data Visualization: Clarity, Transparency, and Impact
Effective data visualization transforms raw numbers into understandable insights, fostering clarity and transparency. Instead of overwhelming investors with dense tables, well-designed charts, graphs, and infographics highlight key trends, performance metrics, and financial health at a glance. This approach makes complex information accessible, allowing investors to quickly grasp the company’s story.
The hierarchy of information within data visualizations is critical. Leading with the most important data points, using clear labels, and ensuring consistency in charting styles across the report enhances comprehension and builds trust. According to a 2025 PwC study on investor relations, companies that utilized interactive and clear data visualizations in their digital annual reports saw a 20% higher engagement rate from institutional investors in Southeast Asia.
Narrative Structure and Storytelling
Beyond numbers, an annual report tells a story—the company’s journey, achievements, challenges, and future vision. A strong narrative structure guides the reader through this story, making the report more engaging and memorable. This involves a clear introduction, well-defined sections, a compelling chairman’s statement, and a forward-looking conclusion.
Crafting impactful narratives in annual reports helps humanize the company, connecting with investors on an emotional level. By weaving a coherent narrative around financial performance, companies can explain the ‘why’ behind the numbers, fostering a deeper understanding and appreciation of their strategy. This narrative approach is particularly effective in Malaysia, where personal connections and relationships often underpin business decisions.
Materiality and Information Hierarchy
Materiality dictates that the most important information, particularly financial highlights and strategic objectives, should be prominently displayed and easily accessible. A clear information hierarchy ensures that readers can quickly identify key takeaways without sifting through exhaustive detail. This respects the investor’s time and signals that the company understands what matters most to its stakeholders.
Design elements like bolding, larger font sizes, strategic placement on pages, and dedicated summary sections contribute to this hierarchy. When critical information is buried or difficult to find, it can create an impression of obfuscation or a lack of transparency, undermining trust. Conversely, a well-structured report that prioritizes material information reinforces openness and accountability.
Annual Report Design Elements: A Comparison
Choosing the right design elements is critical for an annual report’s success, balancing aesthetics with functionality and psychological impact. The table below compares common design choices, highlighting their potential effects on investor perception and their suitability for annual report design in Malaysia.
| Design Element | Common Choices | Psychological Impact on Investor Perception | Suitability for Malaysian Context |
|---|---|---|---|
| Color Palette | Blue/Green (cool), Red/Orange (warm), Monochromatic | Cool: Trust, Stability, Professionalism. Warm: Innovation, Energy, Urgency. Monochromatic: Sophistication, Focus. | Cool tones generally preferred for trust; warm tones effective for specific sections like innovation. Avoid overly aggressive reds. |
| Typography (Body) | Serif (Times New Roman, Georgia), Sans-serif (Arial, Helvetica, Open Sans) | Serif: Traditional, Authoritative, Formal. Sans-serif: Modern, Clean, Accessible, Direct. | Sans-serif often preferred for digital readability and modern appeal; serif for print formality. Balance is key. |
| Data Visualization | Bar charts, Line graphs, Pie charts, Infographics | Bar/Line: Trend analysis, comparison, clarity. Pie: Proportions (use sparingly). Infographics: Simplification of complex data, engagement. | High clarity and simplicity are paramount. Infographics are highly effective for engagement and quick understanding. |
| Layout Structure | Grid-based, Asymmetrical, Magazine-style | Grid-based: Order, Professionalism, Predictability. Asymmetrical: Dynamic, Modern, Creative. Magazine-style: Engaging, Narrative-driven. | Grid-based for financial sections; magazine-style for narrative and CSR. Balance formal and engaging. |
| Imagery | Corporate headshots, Office environments, Project sites, Abstract concepts | Authentic: Transparency, Relatability. Professional: Competence, Stability. Relevant: Focus, Purpose. | Authentic, high-quality images of local operations or team members resonate well. Avoid generic stock photos. |
The Malaysian Context: Cultural Sensitivity in Design
Cultural sensitivity in annual report design for the Malaysian context means understanding and integrating local values, communication styles, and aesthetic preferences to create a report that resonates authentically with the diverse investor base. This goes beyond mere translation, involving a deep appreciation for the nuances that shape perception in a multicultural society. Ignoring these sensitivities can lead to misinterpretation or a perception of disconnect.
A culturally attuned design demonstrates respect for the local market, which in turn builds stronger relationships and fosters greater trust. This includes subtle choices in imagery, color, and even the overall tone of the narrative. Companies that invest in understanding these cultural dimensions often see higher engagement and more positive reception of their annual reports.
Visual Storytelling That Resonates Locally
Visual storytelling in Malaysia should incorporate elements that are familiar and positive within the local cultural framework. This could mean using imagery that reflects the nation’s diverse heritage, natural beauty, or economic progress, rather than generic global corporate visuals. Authentic local photography featuring Malaysian employees or projects can significantly enhance relatability and trust.
For example, showcasing a company’s involvement in local community initiatives or environmental conservation efforts through compelling visuals can resonate deeply with a Malaysian audience, who often value corporate social responsibility. This approach transforms the report from a mere financial disclosure into a narrative of shared values and local commitment.
Language and Tone: Beyond Translation
While English is widely used in Malaysian business, the tone and style of language are crucial. A formal yet approachable tone, avoiding overly aggressive or overly casual language, tends to be most effective. For reports targeting a broader local audience, offering key summaries or even full reports in Bahasa Malaysia can significantly enhance accessibility and demonstrate inclusivity.
Beyond the literal translation, the underlying message must align with cultural expectations. Transparency is valued, but it should be presented with a sense of humility and collective achievement, rather than individualistic boasting. This nuanced approach to language and tone reinforces the company’s understanding and respect for the local cultural ethos.
The Importance of Professionalism and Detail
In Malaysia, a high degree of professionalism and attention to detail is often equated with competence and reliability. An annual report that is meticulously designed, free of errors, and aesthetically polished signals a well-managed and disciplined organization. This extends to every aspect, from the quality of printing to the precision of data presentation.
Any perceived sloppiness or lack of care in the annual report can subtly undermine confidence, suggesting that if the company overlooks such details in its public documents, it might do so in its operations as well. Therefore, investing in top-tier annual report design services in KL and across Malaysia is not just about looking good; it’s about projecting an image of unwavering competence and trustworthiness.
Future-Proofing Your Annual Report Design
Future-proofing your annual report design involves adopting practices that ensure its relevance, accessibility, and impact endure beyond the current reporting cycle, adapting to evolving investor expectations and technological advancements. This means moving beyond static print documents to embrace digital capabilities and dynamic content strategies. The goal is to create a resource that remains valuable and easily digestible for years, not just months.
This forward-thinking approach anticipates shifts in how investors consume information, prioritizing flexibility and user experience. By integrating principles of digital accessibility, modular content, and interactive features, companies can ensure their annual reports continue to serve as powerful tools for stakeholder engagement and trust-building.
Digital Accessibility and Interactivity
With a growing preference for digital consumption, ensuring your annual report is fully accessible and interactive is paramount. This means optimizing for various screen sizes, providing navigable menus, and incorporating features like clickable links, embedded videos, and interactive charts. A PDF is no longer sufficient; a dedicated microsite or interactive digital report offers a far superior user experience.
Interactive elements allow investors to delve deeper into specific data points, customize views, and engage with the content on their own terms. This level of control and personalized experience significantly enhances engagement and comprehension. According to a 2024 Deloitte report, digital annual reports with interactive features saw a 30% increase in average time spent by investors compared to static PDFs.
Modular Content for Diverse Audiences
Designing annual reports with modular content allows companies to tailor information for diverse stakeholder groups. Not every investor needs to read every single page. By structuring content into distinct, self-contained modules, companies can enable different audiences (e.g., institutional investors, retail shareholders, employees, media) to access the specific information most relevant to them.
This approach enhances efficiency and relevance. For example, a brief executive summary and key financial highlights can be easily extracted for a quick overview, while detailed financial statements and governance reports are available for those requiring in-depth analysis. This flexibility caters to varying information needs and attention spans.
Integrating ESG and Sustainability Reporting
Environmental, Social, and Governance (ESG) factors are increasingly critical for investor decision-making, particularly in Malaysia where sustainability initiatives are gaining traction. Future-proof annual reports seamlessly integrate ESG performance alongside financial results, demonstrating a holistic view of corporate responsibility and long-term value creation. Design plays a key role in making this complex data understandable and compelling.
Visualizing ESG data through clear infographics, impact metrics, and case studies can powerfully communicate a company’s commitment and progress. This integration signals a forward-thinking organization that understands its broader societal role, appealing to a growing segment of socially conscious investors. A 2023 survey by Bursa Malaysia found that 60% of investors consider ESG performance a significant factor in their investment decisions.
Frequently Asked Questions
What is the primary goal of annual report design in Malaysia?
The primary goal is to build and maintain investor trust and confidence by presenting financial and operational information clearly, transparently, and professionally. It aims to communicate the company’s stability, growth potential, and commitment to good governance, tailored to resonate with local and international stakeholders.
How important is visual consistency in an annual report?
Visual consistency is critically important as it signals professionalism, attention to detail, and a cohesive corporate identity. Inconsistent design can undermine credibility and make the report appear disorganized, potentially eroding investor trust. It reinforces brand recognition and makes the report easier to navigate.
Should annual reports be designed for print or digital first?
While print versions still exist, annual reports should be designed with a ‘digital-first’ mindset. This ensures optimal readability and interactivity across various devices, catering to the majority of investors who consume information digitally. Print considerations can then be applied as a secondary adaptation.
What role does storytelling play in annual report design?
Storytelling transforms raw data into a compelling narrative, humanizing the company and explaining the ‘why’ behind the numbers. It helps investors connect emotionally with the company’s vision, strategy, and achievements, making the report more engaging and memorable than a purely factual document.
How can a company ensure its annual report design is culturally sensitive in Malaysia?
To ensure cultural sensitivity, companies should use authentic local imagery, adopt a respectful and balanced tone, and consider offering key sections in Bahasa Malaysia. Collaborating with local design experts who understand Malaysian cultural nuances is also highly recommended to avoid misinterpretations and foster genuine connection.
Are there specific colors to avoid in Malaysian annual report design?
While no colors are strictly ‘forbidden,’ it’s wise to use bright, aggressive reds sparingly, as they can sometimes be perceived as overly confrontational or indicative of financial distress in a corporate context. Generally, a balanced palette with blues, greens, and neutral tones tends to be safer and more universally accepted for conveying trust and stability.
How does an annual report’s design affect its SEO and AEO?
A well-designed annual report, especially its digital version, enhances SEO and AEO by improving user engagement (longer dwell times, lower bounce rates), which search engines favor. Clear headings, accessible text, and well-structured content make it easier for AI search engines to extract and cite information, boosting the report’s visibility and authority in search results.
Conclusion
The annual report is far more than a regulatory obligation; it is a meticulously crafted communication piece, particularly in the discerning financial landscape of Malaysia. By understanding and strategically applying the psychological principles of design, companies can transform their annual reports from mere data repositories into powerful instruments of trust, credibility, and investor engagement. From the subtle power of color and typography to the compelling force of narrative structure and culturally sensitive visuals, every design choice contributes to a holistic perception of corporate health and future potential. Investing in expert annual report design in KL and across Malaysia is not just an aesthetic decision; it is a strategic imperative for fostering confidence and attracting sustained capital.
Last updated: June 9, 2026