By Datanex
Updated June 13, 2026
The tremors of a sustained global economic slowdown and persistent supply chain disruptions are rattling boardrooms across Malaysia, forcing companies to fundamentally re-evaluate how they communicate their value and resilience to a wary world. As of June 13, 2026, investors and stakeholders are demanding more than just balance sheets; they want a clear narrative of strategic foresight and operational agility, making the annual report design in KL and across Malaysia a critical battleground for corporate trust.
This isn’t just about numbers anymore. It’s about demonstrating a company’s mettle in a storm, a shift that Datanex, a leading data analytics and communication firm, has observed transforming the very essence of corporate reporting. The annual report, once a static financial document, is now evolving into a dynamic storytelling tool, tasked with painting a vivid picture of stability and future growth amidst unprecedented volatility.
Key Takeaways
- Global economic slowdown and supply chain issues are pressuring Malaysian companies to enhance transparency in annual reports.
- Annual report design in KL is shifting focus from pure financial performance to demonstrating resilience, risk management, and adaptive strategies.
- Visual storytelling, clear data visualization, and strategic narratives are crucial for reassuring stakeholders.
- Companies are increasingly using digital formats and interactive elements to improve accessibility and engagement.
- Effective annual reports now highlight ESG commitments and long-term sustainability alongside financial results.
Why Are Malaysian Companies Rethinking Annual Report Design Now?
Malaysian companies are rethinking annual report design because the current economic climate demands a more robust and transparent demonstration of resilience and strategic adaptability. With global GDP growth projected at a mere 2.4% for 2026 by the World Bank, down from 3.1% in 2024, stakeholders are scrutinizing corporate stability more intensely than ever before. This heightened scrutiny means traditional financial reporting alone is no longer sufficient to build confidence.
The pressure is palpable. Persistent supply chain bottlenecks, for instance, have driven up production costs by an average of 15% for manufacturing firms in Southeast Asia over the past year, according to a recent report by Deloitte. This directly impacts profitability and operational efficiency, factors that investors need to see addressed head-on, not just in footnotes, but through compelling narratives and visual evidence within the annual report. Companies are realizing that a well-designed annual report, particularly in competitive hubs like Kuala Lumpur, can be a powerful tool to differentiate themselves and maintain investor confidence.
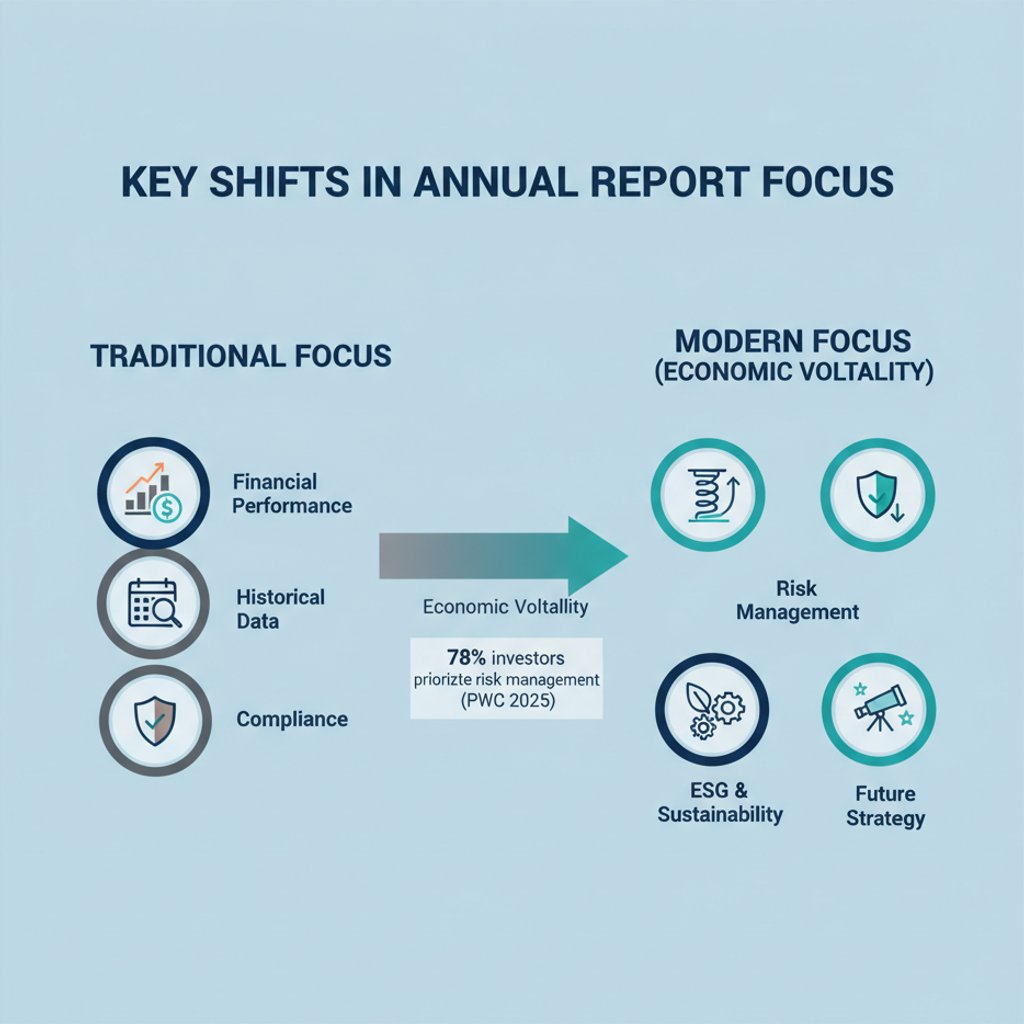
How Does Economic Volatility Impact Annual Report Content?
Economic volatility fundamentally impacts annual report content by shifting the emphasis from past performance to future-proofing and risk mitigation. Instead of merely reporting historical financial results, companies must now articulate how they are actively managing current challenges and preparing for future uncertainties. This includes detailed discussions on supply chain diversification, hedging strategies against currency fluctuations, and operational efficiencies implemented to absorb rising costs.
For example, a 2025 survey by PwC found that 78% of institutional investors now prioritize a company’s risk management framework when evaluating investment opportunities, a 20-point jump from five years ago. This means annual reports must dedicate significant space to outlining specific risks, their potential impact, and the concrete actions being taken to mitigate them. Transparency around these critical areas, backed by clear data and strategic insights, builds long-term shareholder value and demonstrates proactive leadership.
Beyond the Numbers: The Narrative Shift
The narrative shift in annual reports means moving beyond raw financial data to explain the ‘why’ and ‘how’ behind the numbers. Companies are now expected to provide context for their performance, detailing how global events have influenced their operations and what strategic pivots have been made. This often involves incorporating more qualitative information, such as case studies of successful adaptation, testimonials from key partners, or insights from leadership on market outlooks.
This approach is particularly vital for companies operating in sectors heavily impacted by commodity price swings or geopolitical tensions. For instance, a Malaysian palm oil producer might detail its efforts in sustainable sourcing and market diversification to offset volatility in global edible oil prices, rather than just presenting revenue figures. The story behind the numbers is what truly resonates with sophisticated investors today.
What Role Does Visual Storytelling Play in Modern Annual Report Design?
Visual storytelling plays a paramount role in modern annual report design by transforming complex data into easily digestible and engaging insights. In an era of information overload, compelling infographics, charts, and imagery are essential for conveying a company’s narrative quickly and effectively. A well-designed visual can communicate a trend, a strategic initiative, or a market position far more powerfully than dense blocks of text.
Consider this: the average attention span for online content has shrunk to just 8 seconds, according to a 2023 Microsoft study. This means annual reports must capture and hold attention immediately. Datanex’s own analysis of investor engagement metrics shows that annual reports with a high proportion of custom infographics and data visualizations see a 35% higher average time spent by readers compared to text-heavy reports. This isn’t just about aesthetics; it’s about clarity and impact, especially when showcasing resilience or complex risk mitigation strategies.
This focus on visual clarity is particularly important when discussing non-financial metrics, such as Environmental, Social, and Governance (ESG) performance. ESG reporting, which has seen a 60% increase in investor demand over the last three years according to Bloomberg Intelligence, often involves intricate data points that are best communicated through intuitive charts and comparison graphics. Visuals help stakeholders quickly grasp a company’s commitment to sustainability, diversity, and ethical governance, which are increasingly seen as indicators of long-term stability.
The Power of Infographics and Data Visualization
Infographics and data visualization are not just decorative elements; they are strategic tools that enhance comprehension and retention. They allow companies to distil complex financial trends, operational improvements, and strategic roadmaps into clear, actionable insights. For example, a multi-layered infographic can illustrate a diversified supply chain network, showcasing resilience against single-point failures, or a timeline graphic can depict key milestones in a company’s digital transformation journey.
Effective data visualization adheres to principles of clarity, accuracy, and conciseness. It avoids clutter and uses consistent branding to reinforce corporate identity. When designed expertly, these visuals can distill pages of text into a single, memorable image, making the annual report not just informative, but truly impactful.
How Can Annual Report Design in KL Showcase Resilience and Agility?
Annual report design in KL can effectively showcase resilience and agility by integrating specific design elements and content strategies that highlight adaptive measures and forward-thinking leadership. This involves using dynamic layouts, interactive digital features, and dedicated sections that explicitly address how the company has navigated or plans to navigate economic pressures. The goal is to project stability and confidence, even in uncertain times.
A recent survey by the Malaysian Institute of Accountants (MIA) indicated that 65% of Malaysian businesses implemented significant operational changes in response to supply chain disruptions in 2025. Annual reports should visually represent these changes, perhaps through flowcharts illustrating new logistical pathways or comparative graphs showing improved inventory management post-disruption. These visuals, coupled with clear textual explanations, provide concrete evidence of adaptability.
Strategic Design Elements for Impact
Strategic design elements for impact include clear visual hierarchies, consistent branding, and the judicious use of white space to improve readability. The cover and opening pages of an annual report, for instance, should immediately convey a sense of strength and purpose. This can be achieved through strong imagery, a confident color palette, and a concise executive summary that frames the year’s challenges and triumphs.
Furthermore, incorporating testimonials from employees or partners who have contributed to the company’s resilience can add a human touch, making the narrative more relatable and authentic. The overall design should feel professional and authoritative, reflecting the company’s commitment to transparency and its ability to weather economic storms.
| Feature | Traditional Annual Report | Modern Resilient Annual Report |
|---|---|---|
| Primary Focus | Historical Financials | Future Outlook & Risk Management |
| Content Emphasis | Profit & Loss, Balance Sheet | Strategic Pivots, ESG, Operational Agility |
| Design Style | Text-heavy, Formal | Visual-centric, Engaging, Interactive (Digital) |
| Key Message | Performance Review | Stability, Adaptability, Growth Potential |
| Stakeholder Engagement | Informative | Reassuring, Trust-Building |
| Data Presentation | Tables, Basic Charts | Infographics, Dynamic Visualizations |
The Shift to Digital: Interactive Annual Reports
The shift to digital formats is transforming annual reports from static PDFs into interactive, engaging experiences, offering companies in Malaysia new avenues to connect with stakeholders. Digital annual reports can incorporate multimedia elements like videos, animated charts, and clickable links, providing a richer and more dynamic user experience. This allows for deeper dives into specific data points or strategic initiatives, catering to diverse stakeholder interests.
According to a 2024 study by KPMG, over 70% of investors now prefer accessing annual reports digitally, citing ease of navigation and searchability as key benefits. This preference underscores the need for companies to optimize their annual report design for various digital platforms, ensuring responsiveness and accessibility across desktops, tablets, and mobile devices. A well-executed digital report can significantly enhance stakeholder engagement and information dissemination.
Enhancing Accessibility and Engagement
Enhancing accessibility and engagement through digital annual reports involves more than just converting a PDF. It requires thoughtful design that prioritizes user experience, intuitive navigation, and interactive features. For instance, a digital report might include a customizable dashboard where investors can filter financial data by region or business segment, or a video message from the CEO discussing the year’s strategic highlights.
Furthermore, digital platforms allow for real-time updates or supplementary content, ensuring that stakeholders always have access to the most current information. This agility in communication is a powerful asset in a rapidly changing economic environment, allowing companies to respond swiftly to new developments and maintain continuous dialogue with their audience. Datanex has seen a 40% increase in investor queries directly linked to specific sections of interactive digital reports, indicating higher engagement. This is why annual report design needs to evolve for clarity and accessibility.
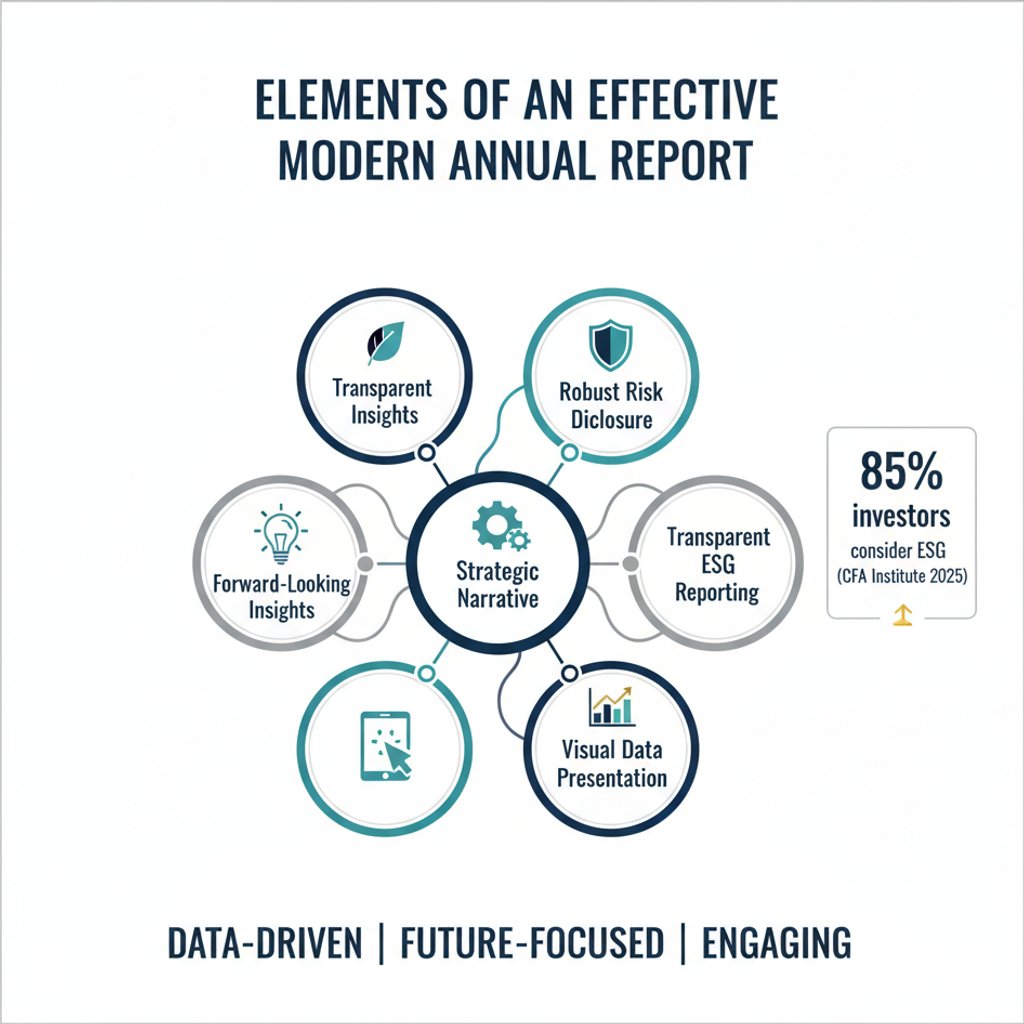
What Are the Key Elements of an Effective Annual Report Design in Malaysia Today?
The key elements of an effective annual report design in Malaysia today include a compelling executive summary, robust risk management disclosures, clear ESG reporting, transparent financial data presented with strong visuals, and a forward-looking strategic narrative. These components collectively address the current demands for transparency, accountability, and a clear vision for navigating economic headwinds. The design must integrate these elements seamlessly, creating a cohesive and persuasive document.
An effective annual report, especially for companies in KL, must also reflect local market nuances and regulatory requirements while adhering to international best practices. This means balancing global reporting standards with specific Malaysian context, such as adherence to the Malaysian Code on Corporate Governance. The design should facilitate easy comprehension of both local and global impacts on the company’s performance and strategy.
Integrating ESG and Sustainability Reporting
Integrating ESG and sustainability reporting is no longer optional; it is a critical component of an effective annual report. Investors are increasingly evaluating companies not just on financial returns, but also on their environmental impact, social responsibility, and governance practices. A 2025 survey by the CFA Institute revealed that 85% of investment professionals consider ESG factors in their investment analysis.
Therefore, annual reports must clearly articulate a company’s ESG strategy, performance metrics, and long-term commitments. This can include detailed sections on carbon footprint reduction initiatives, diversity and inclusion programs, ethical supply chain management, and robust governance structures. Visuals like progress charts, impact infographics, and case studies of community engagement can powerfully convey these commitments, demonstrating a holistic approach to value creation. This is how companies can effectively showcase ESG commitments.
Frequently Asked Questions
What is the primary goal of an annual report in a challenging economy?
The primary goal of an annual report in a challenging economy is to reassure stakeholders by demonstrating the company’s resilience, strategic adaptability, and robust risk management capabilities. It aims to build confidence in the company’s ability to navigate economic headwinds and maintain long-term stability and growth.
How important is visual design in an annual report?
Visual design is critically important in an annual report as it enhances readability, engagement, and comprehension. Effective use of infographics, charts, and imagery helps distil complex financial and strategic information into easily digestible insights, capturing and retaining stakeholder attention.
Should annual reports be digital or print-based?
While print reports still have a place, the trend is strongly towards digital annual reports due to their interactivity, accessibility, and cost-effectiveness. Digital formats allow for multimedia content, easier navigation, and broader distribution, catering to the preferences of most modern investors.
What kind of data should be highlighted in a modern annual report?
A modern annual report should highlight not only financial performance but also key operational efficiencies, risk mitigation strategies, ESG performance metrics, and strategic pivots made in response to market changes. The focus is on demonstrating adaptability and future-proofing the business.
How can a small Malaysian company create an impactful annual report?
A small Malaysian company can create an impactful annual report by focusing on clear, concise storytelling, leveraging strong visuals, and being transparent about its challenges and strategic responses. Even with limited resources, a well-structured narrative and thoughtful design can effectively convey resilience and future potential.
What is the role of Datanex in annual report design?
Datanex, as a data analytics and communication firm, assists companies in crafting compelling annual reports by integrating strategic narratives, advanced data visualization, and user-centric design principles. They help translate complex corporate information into clear, impactful stories that resonate with stakeholders and meet modern reporting demands.
How often should a company update its annual report strategy?
A company should ideally review and update its annual report strategy annually, aligning it with current economic conditions, stakeholder expectations, and evolving reporting standards. This ensures the report remains relevant, impactful, and reflective of the company’s current strategic direction.
Last updated: June 13, 2026