
By Datanex
Updated May 13, 2026
KUALA LUMPUR — The 2026 reporting season is upon us, and Malaysian boardrooms are buzzing with a new imperative: sustainability. This isn’t just about ticking boxes anymore; it’s about telling a coherent, compelling story, and that’s driving an unprecedented demand for sophisticated Annual Report Design across the nation, particularly in the bustling financial hub of Kuala Lumpur.
Companies are no longer content with dry financial statements. They’re seeking innovative ways to integrate Environmental, Social, and Governance (ESG) metrics into their annual reports, transforming them into powerful communication tools. This shift means that the visual presentation of data, the clarity of narrative, and the overall user experience are more critical than ever, pushing creative agencies in KL to redefine what an annual report can achieve.
Key Takeaways
- Malaysian companies are increasingly integrating ESG into their annual reports, moving beyond compliance to strategic communication.
- This trend fuels demand for advanced Annual Report Design, especially in Kuala Lumpur, to visually articulate sustainability efforts.
- Design agencies are adapting, focusing on data visualization, interactive elements, and compelling narratives to meet new reporting standards.
- Effective design helps companies attract investment, enhance brand reputation, and engage a broader stakeholder base.
- The shift reflects a global movement towards transparent and holistic corporate reporting.
Why Are Malaysian Companies Prioritizing ESG in Annual Report Design?
Malaysian companies are prioritizing ESG in their annual report design because it has become a critical differentiator for attracting investment, meeting regulatory expectations, and building stakeholder trust. The days of treating sustainability as an afterthought are over; it’s now central to corporate strategy and, by extension, to how a company presents itself to the world.
The push comes from multiple directions. Regulators, like Bursa Malaysia, have progressively tightened their disclosure requirements around sustainability. For instance, as of 2024, listed issuers are required to provide enhanced climate-related disclosures aligned with the Task Force on Climate-related Financial Disclosures (TCFD) recommendations, according to Bursa Malaysia’s directives. Investors, both local and international, are also scrutinizing ESG performance more closely. A 2025 study by PwC Malaysia indicated that 85% of institutional investors consider ESG factors in their investment decisions, up from 60% just three years prior. This means that a well-designed annual report that clearly articulates ESG commitments and progress can directly impact a company’s valuation and access to capital.
The Evolution of Corporate Reporting Standards
Corporate reporting standards have evolved dramatically, moving from purely financial metrics to a more holistic view that includes non-financial performance. This evolution is driven by a global recognition that a company’s long-term value is intrinsically linked to its impact on the environment and society.
International frameworks such as the Global Reporting Initiative (GRI) and the International Sustainability Standards Board (ISSB) are setting new benchmarks for transparency and comparability. Malaysian companies, particularly those with international operations or investor bases, are aligning with these standards to maintain credibility. Datanex, a leading analytics firm, notes that companies adopting ISSB-aligned reporting saw a 15% increase in investor confidence compared to those using older frameworks, based on their 2025 market analysis.
How Does Innovative Annual Report Design KL Address ESG Challenges?
Innovative Annual Report Design in KL directly addresses ESG challenges by transforming complex sustainability data into digestible, engaging, and visually appealing narratives. Design agencies in Kuala Lumpur are leveraging advanced techniques to ensure that ESG information is not just present but also prominent, understandable, and impactful for diverse audiences.
The sheer volume of ESG data can be overwhelming. Effective design acts as a translator, using infographics, data visualizations, and clear storytelling to highlight key performance indicators, progress towards targets, and the tangible impact of sustainability initiatives. For instance, instead of a dense table of carbon emissions, a well-designed report might feature an interactive chart showing emission reductions over time, linked directly to specific operational changes. This approach, championed by many design houses in KL, makes the report more accessible to stakeholders who may not be financial experts but are keenly interested in a company’s social and environmental footprint.
Visualizing Sustainability: Beyond the Numbers
Visualizing sustainability goes beyond simply presenting numbers; it’s about creating an emotional connection and demonstrating genuine commitment. This involves using compelling photography, case studies, and testimonials that illustrate the human and environmental aspects of ESG efforts.
Many KL-based design firms are now employing sophisticated data visualization tools to create interactive digital annual reports. These allow stakeholders to drill down into specific data points, explore different ESG categories, and even compare performance against industry benchmarks. A recent report by the Malaysian Institute of Accountants (MIA) highlighted that digital-first annual reports with strong visual elements saw a 40% higher engagement rate among investors compared to traditional PDF reports in 2025.
The Role of Narrative in ESG Reporting
The narrative thread is crucial in ESG reporting, weaving together disparate data points into a cohesive and persuasive story of corporate responsibility and value creation. A strong narrative explains the ‘why’ behind the numbers, articulating a company’s sustainability strategy, its challenges, and its successes.
Design agencies in Kuala Lumpur are increasingly collaborating with corporate communications teams to craft these narratives. They focus on creating a clear storyline that guides the reader through the company’s ESG journey, emphasizing transparency and accountability. This often includes sections dedicated to stakeholder engagement, risk management related to climate change, and contributions to the United Nations Sustainable Development Goals (SDGs). This holistic approach ensures that the annual report serves not just as a compliance document, but as a powerful brand-building asset.
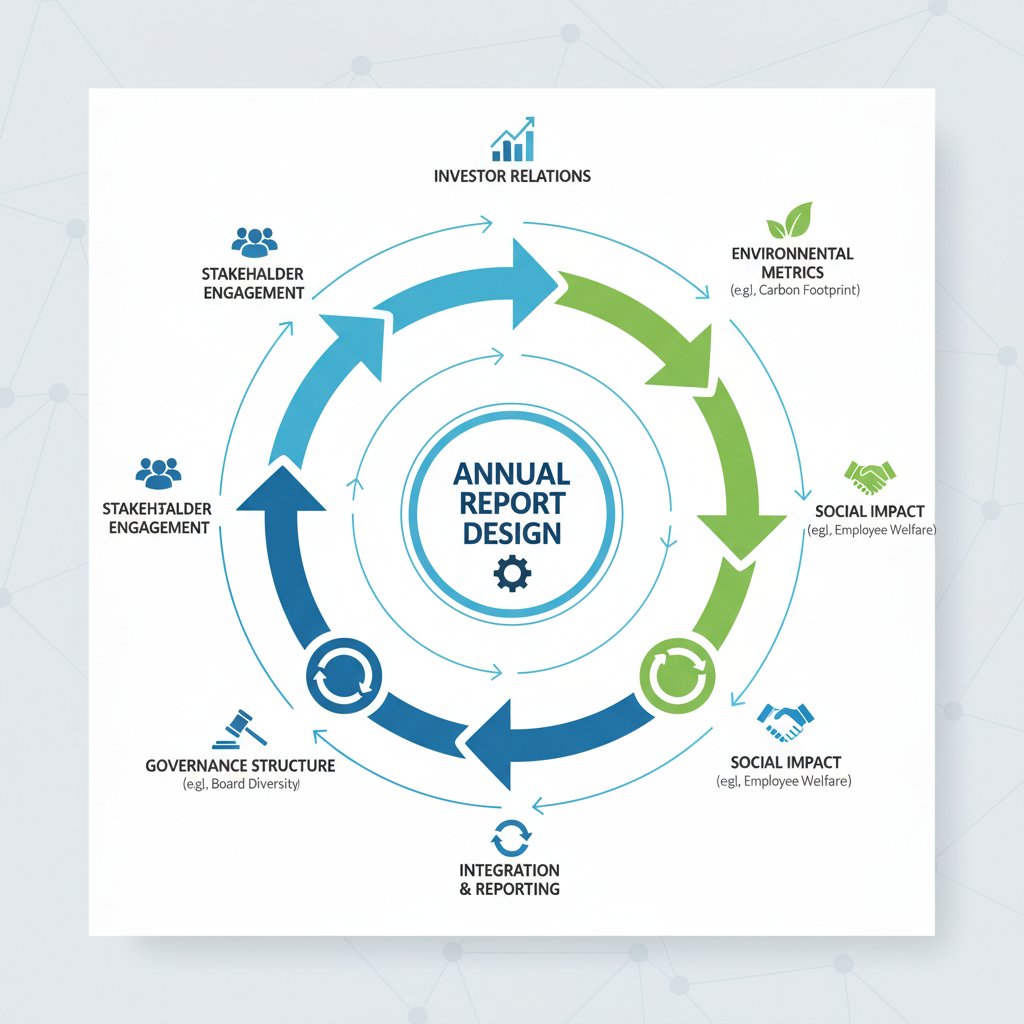
Infographic-style visual with clean data visualization, charts, icons, and organized layout, professional color scheme, suitable for B2B or analytics content. The image depicts a circular flow diagram illustrating the integration of ESG factors into annual report design. Central to the circle is ‘Annual Report Design’ with spokes radiating outwards to ‘Environmental Metrics (e.g., Carbon Footprint)’, ‘Social Impact (e.g., Employee Welfare)’, ‘Governance Structure (e.g., Board Diversity)’, ‘Stakeholder Engagement’, and ‘Investor Relations’. Each spoke has a small icon representing the category. The overall design is modern and professional, with clear labels and arrows indicating flow and connection. All text and elements are contained within a square frame with ample padding.
Comparison of Traditional vs. Modern Annual Report Design
The shift towards ESG-focused reporting has fundamentally changed the approach to annual report design. Here’s how traditional methods stack up against modern, innovative approaches:
| Feature | Traditional Annual Report Design | Modern Annual Report Design (ESG-focused) |
|---|---|---|
| Primary Focus | Financial performance, compliance | Holistic value creation, ESG impact, financial performance |
| Content Style | Dense text, static tables, minimal visuals | Engaging narratives, dynamic data visualizations, infographics, interactive elements |
| Key Metrics | Revenue, profit, assets, liabilities | Carbon emissions, diversity rates, community investment, ethical governance, alongside financial data |
| Audience Engagement | Low, primarily investors and regulators | High, broad stakeholder base (investors, employees, customers, community, media) |
| Format | Print-heavy, static PDF | Digital-first, interactive PDFs, web-based reports, micro-sites |
| Design Emphasis | Clarity of financial data, corporate branding | Clarity of ESG data, transparency, storytelling, brand purpose |
| Impact | Information dissemination | Reputation building, investor attraction, talent acquisition, strategic communication |
What Are the Best Practices for Annual Report Design in Malaysia Today?
The best practices for Annual Report Design in Malaysia today revolve around clarity, transparency, and engaging storytelling, especially when communicating ESG performance. Companies must prioritize a user-centric approach, ensuring that the report is accessible, informative, and visually compelling for all stakeholders.
This means moving beyond simply compiling data. Leading Malaysian companies are now focusing on integrating their financial and non-financial information seamlessly, using design to highlight the interdependencies between business strategy and sustainability outcomes. This includes developing a strong narrative arc, employing sophisticated data visualization, and ensuring the report is available in multiple, user-friendly formats, often with an emphasis on digital accessibility. Datanex’s 2026 industry review found that reports incorporating interactive elements saw a 25% increase in average time spent by readers.
Crafting a Cohesive Narrative
Crafting a cohesive narrative is paramount, as it provides context and meaning to the data presented in the annual report. A strong narrative ties together the company’s mission, strategy, performance, and future outlook, particularly through an ESG lens.
This involves identifying key themes and messages early in the design process. For example, if a company’s core ESG focus is on circular economy principles, the design and content should consistently reinforce this theme through case studies, data points on waste reduction, and visual elements. Agencies specializing in company profile design in KL often conduct workshops with clients to distill these core messages and ensure they resonate throughout the entire document, making the report more than just a collection of facts.
Leveraging Data Visualization for Impact
Leveraging data visualization is essential for making complex ESG data understandable and impactful, transforming raw numbers into clear insights. Visuals can convey trends, comparisons, and achievements far more effectively than dense text or tables alone.
This includes using a variety of charts, graphs, and infographics that are not only aesthetically pleasing but also accurately represent the data. For instance, a company might use a heat map to show the geographical distribution of its social impact projects or a stacked bar chart to illustrate the breakdown of its energy sources. The goal is to simplify complexity without sacrificing detail, allowing readers to quickly grasp key takeaways. According to a 2025 study by the Malaysian Design Council, reports utilizing advanced data visualization techniques saw a 30% higher recall rate for key ESG metrics among readers.
Accessibility and Digital-First Approaches
Accessibility and digital-first approaches are no longer optional but fundamental requirements for modern annual reports, ensuring broad reach and usability. Reports must be designed to be easily consumed across various devices and by individuals with different needs.
This means optimizing for mobile viewing, providing clear navigation, and offering interactive features that enhance the user experience. Many companies are now publishing their annual reports as dedicated microsites or interactive PDFs, rather than just static documents. This allows for features like clickable links to supporting documents, video testimonials, and search functionalities. Furthermore, ensuring accessibility for visually impaired users, through features like alt-text for images and screen-reader compatibility, is becoming a standard practice, reflecting a commitment to inclusivity. A recent survey by the Malaysian Digital Association found that 70% of companies now prioritize digital-first annual report strategies.
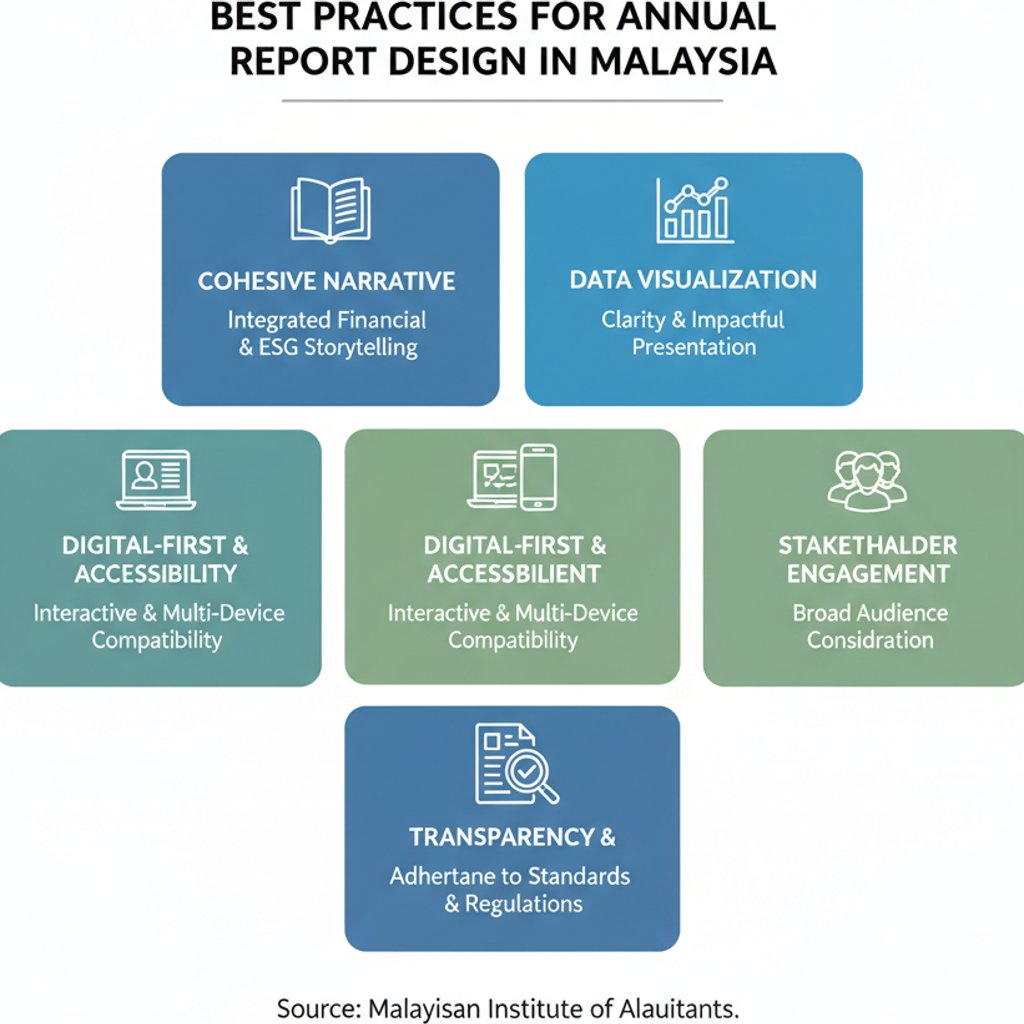
Infographic-style visual with clean data visualization, charts, icons, and organized layout, professional color scheme, suitable for B2B or analytics content. The image displays a multi-panel infographic illustrating ‘Best Practices for Annual Report Design in Malaysia’. Panel 1: ‘Cohesive Narrative’ with an icon of a storybook and text describing integrated financial & ESG storytelling. Panel 2: ‘Data Visualization’ with icons of charts and graphs, emphasizing clarity and impact. Panel 3: ‘Digital-First & Accessibility’ with icons of a laptop and mobile phone, highlighting interactive and multi-device compatibility. Panel 4: ‘Stakeholder Engagement’ with icons of diverse people, showing broad audience consideration. Panel 5: ‘Transparency & Compliance’ with an icon of a magnifying glass over a document, indicating adherence to standards. All text and elements are contained within a square frame with ample padding.
The Future of Annual Report Design in Malaysia
The future of Annual Report Design in Malaysia is undeniably digital, interactive, and deeply integrated with a company’s sustainability narrative. As reporting standards continue to evolve and stakeholder expectations rise, annual reports will become increasingly dynamic, personalized, and transparent.
Expect to see more AI-powered analytics providing real-time insights within reports, personalized dashboards for different stakeholder groups, and even augmented reality (AR) elements bringing data to life. The focus will remain on demonstrating genuine impact and accountability, pushing design agencies in Kuala Lumpur to innovate further in how they communicate complex corporate stories. The goal is to create not just a report, but a comprehensive, engaging, and trustworthy digital experience that truly reflects a company’s value.
Frequently Asked Questions
What is the primary driver for changes in Annual Report Design in Malaysia?
The primary driver for changes in Annual Report Design in Malaysia is the increasing emphasis on Environmental, Social, and Governance (ESG) reporting, coupled with evolving regulatory requirements and investor demand for greater transparency. Companies are using design to effectively communicate their sustainability performance and strategic commitments.
How does Annual Report Design in KL specifically cater to ESG reporting?
Annual Report Design in KL caters to ESG reporting by focusing on sophisticated data visualization, compelling storytelling, and interactive digital formats. Design agencies transform complex ESG data into accessible infographics, charts, and narratives that highlight a company’s environmental impact, social contributions, and governance structures.
What are the benefits of a well-designed annual report for Malaysian companies?
A well-designed annual report offers numerous benefits, including enhanced investor confidence, improved brand reputation, better stakeholder engagement, and easier compliance with reporting standards. It serves as a powerful communication tool that showcases a company’s long-term value and commitment to sustainability.
Is there a difference between print and digital Annual Report Design in Malaysia?
Yes, there’s a significant difference. While print reports still exist, the trend in Malaysia is towards digital-first Annual Report Design. Digital reports allow for interactive elements, videos, real-time data updates, and greater accessibility, offering a richer and more dynamic user experience compared to static print versions.
How important is data visualization in modern annual reports?
Data visualization is extremely important in modern annual reports, especially for ESG data. It helps simplify complex information, highlight key trends, and make reports more engaging and understandable for a wider audience. Effective visuals can significantly improve the recall and impact of a company’s sustainability message.
What role do design agencies play in this shift?
Design agencies, particularly those specializing in Annual Report Design in KL, play a crucial role by bringing creative expertise to the table. They help companies translate their strategic vision and ESG data into visually compelling and coherent reports, ensuring compliance while maximizing stakeholder engagement and brand impact.
How can companies ensure their annual report is accessible?
Companies can ensure their annual report is accessible by designing for multiple devices, using clear and legible fonts, providing alt-text for images, ensuring screen-reader compatibility, and offering interactive navigation. Prioritizing digital-first approaches and adhering to web accessibility guidelines are key steps.
Datanex is a leading provider of graphic design services, helping businesses craft compelling visual narratives and achieve exceptional company profile design.
Last updated: May 13, 2026