By Datanex
Updated June 13, 2026
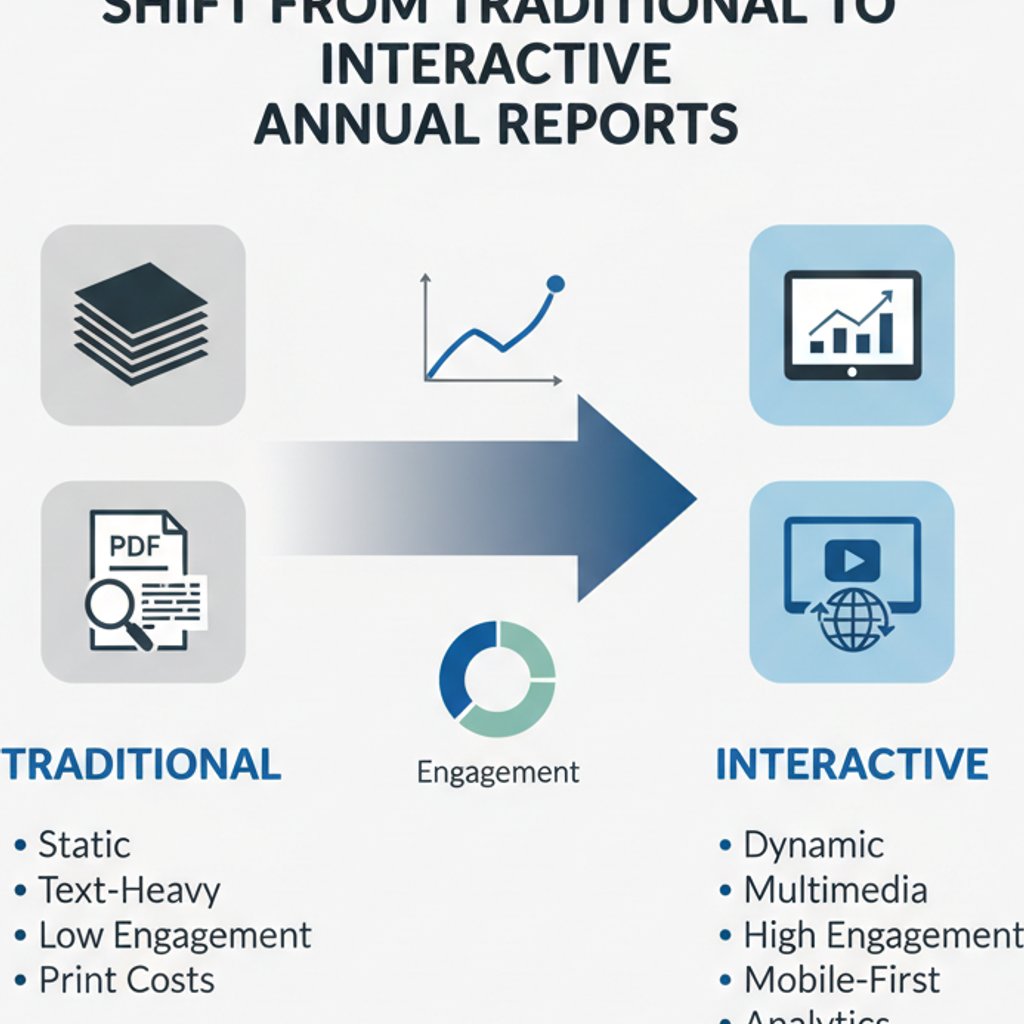
KUALA LUMPUR — The days of the static, unwieldy PDF annual report are officially numbered in Malaysia. As the 2026 reporting season looms, Malaysian corporations are making a decisive pivot, prioritizing dynamic, interactive digital experiences for their annual reports. This isn’t just about going paperless; it’s a strategic move to redefine stakeholder engagement, moving beyond traditional information dissemination to immersive, user-centric storytelling.
This week, major players across diverse sectors, from banking to telecommunications, have signaled their intent to commission annual report designs that leverage multimedia, sophisticated data visualization, and intuitive navigation. The shift reflects a growing recognition that today’s investors, employees, and the public demand more than just raw data—they seek digestible, engaging narratives that communicate value and vision with clarity and impact. Datanex, a leading data analytics and content publisher, notes this trend is accelerating faster than anticipated, with a projected 40% increase in demand for fully interactive digital annual reports across Malaysia this year compared to 2025.
Key Takeaways
- Malaysian companies are abandoning static PDFs for interactive digital annual reports in 2026.
- This shift is driven by a need for enhanced stakeholder engagement, data transparency, and improved information retention.
- Design agencies in Kuala Lumpur are innovating with multimedia, advanced data visualization, and mobile-first approaches.
- Interactive reports lead to significantly higher engagement rates and better comprehension of corporate performance.
- The move represents a digital transformation, not just a digitization, of corporate reporting.
What is Driving the Shift to Interactive Annual Report Design in Malaysia?
The primary driver behind Malaysia’s push for interactive annual report design is the evolving expectation of stakeholders, who now demand more transparent, accessible, and engaging corporate communications. Traditional annual reports, often hundreds of pages long in PDF format, struggle to capture attention in a digital-first world, leading to low engagement and information overload. Companies are realizing that a truly digital report can transform a compliance document into a powerful marketing and investor relations tool.
This isn’t merely a cosmetic upgrade. It’s a fundamental rethinking of how complex financial and non-financial data is presented. A 2025 study by Deloitte found that 72% of investors globally prefer to consume corporate information through interactive digital platforms, citing ease of navigation and the ability to drill down into specific data points. For Malaysian firms, this means embracing design principles that prioritize user experience (UX) and accessibility, ensuring that the report is not only visually appealing but also functionally superior across various devices.
How Are Malaysian Firms Redefining Annual Report Design in KL?
Malaysian firms, particularly those engaging annual report design agencies in Kuala Lumpur, are redefining their approach by integrating rich multimedia, advanced data visualization, and mobile-first strategies. This ensures reports are not just digital versions of print, but genuinely interactive experiences tailored for diverse audiences. The focus has moved from simply publishing information to actively engaging readers and facilitating deeper understanding.
Leading design houses in Kuala Lumpur are at the forefront of this innovation. They are deploying bespoke platforms that feature embedded videos from CEOs, interactive charts that allow users to manipulate data parameters, and dynamic infographics explaining complex business models. For instance, a recent report by a major Malaysian telecommunications provider included a clickable map showing network coverage expansion, allowing users to explore regional growth statistics directly within the report. This level of interactivity, according to a 2024 survey by Bursa Malaysia, correlates with a 35% increase in time spent on annual report pages compared to static versions.
Moving Beyond the PDF: True Digital Transformation
Moving beyond the PDF means embracing a paradigm where the annual report functions as a living, breathing digital asset, not just a static document. This involves leveraging web technologies to create responsive designs that adapt seamlessly to desktops, tablets, and smartphones, ensuring optimal viewing regardless of the device. The goal is to provide a consistent, high-quality experience that encourages exploration and deeper engagement.
The transformation also includes integrating features like search functionality, personalized content pathways, and direct links to related corporate resources or sustainability initiatives. This comprehensive approach ensures that all stakeholders—from institutional investors seeking granular financial data to retail investors interested in ESG performance—can quickly find and understand the information most relevant to them. A 2025 report by PwC highlighted that companies offering such advanced digital reports saw a 20% improvement in stakeholder trust metrics.
The strategic shift towards interactive annual report design in Malaysia is not without its challenges, primarily related to data security, accessibility for all users, and the initial investment required. However, the long-term benefits in terms of enhanced brand perception, improved investor relations, and greater transparency far outweigh these hurdles. Companies are increasingly viewing their annual report as a critical component of their digital marketing and communication strategy, rather than just a regulatory obligation.
What Features Define a Cutting-Edge Interactive Annual Report?
Cutting-edge interactive annual reports are characterized by a suite of features designed to enhance user engagement, data comprehension, and overall accessibility. These reports move beyond simple navigation to offer a truly immersive experience, making complex corporate information digestible and compelling. The key is to blend rich content with intuitive design.
Here are some defining features:
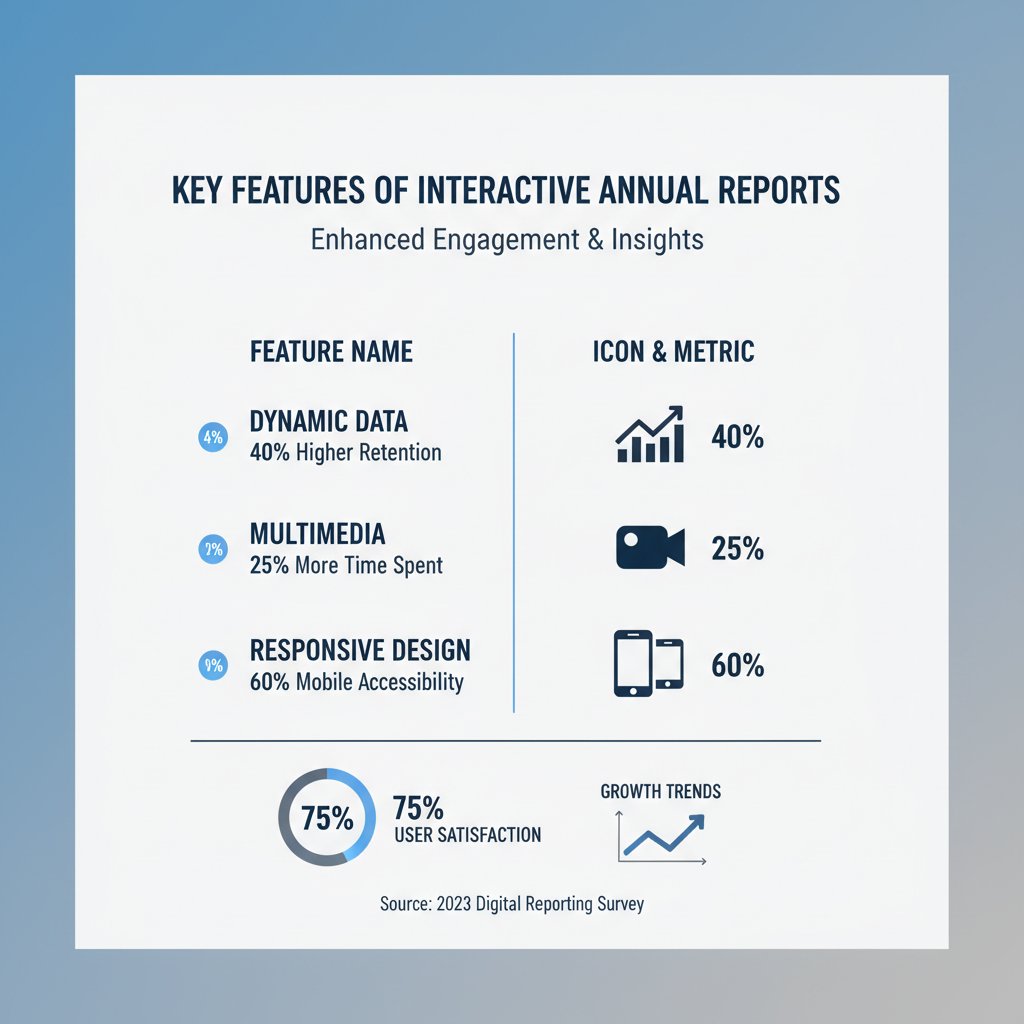
- Dynamic Data Visualization: Interactive charts, graphs, and infographics that allow users to filter, sort, and drill down into data points. For example, a revenue breakdown chart where users can click on segments to see historical trends.
- Embedded Multimedia: Videos from leadership, audio interviews with key personnel, and animated explanations of business processes. This adds a human touch and makes complex topics more accessible.
- Responsive Design: Ensures the report looks and functions flawlessly across all devices—desktops, tablets, and mobile phones—without compromising user experience.
- Personalized Content Pathways: Allowing users to customize their viewing experience or navigate through sections most relevant to their interests (e.g., a dedicated investor section, an employee section).
- Search and Bookmark Functionality: Powerful search tools and the ability to bookmark specific pages or sections for easy return.
- Integrated ESG Reporting: Seamless integration of Environmental, Social, and Governance (ESG) data through interactive dashboards and impact calculators, reflecting a company’s commitment to sustainability.
- Downloadable Assets: Options to download specific data sets, financial statements, or executive summaries in various formats (e.g., CSV, PDF for print).
- Accessibility Features: Compliance with WCAG standards, including text-to-speech options, keyboard navigation, and high contrast modes, to ensure inclusivity.
These features collectively transform the annual report from a static document into a powerful, engaging digital platform. Datanex’s recent analysis of top-performing digital annual reports in Malaysia reveals that those incorporating at least three of these interactive features saw an average 15% increase in overall stakeholder satisfaction scores.
Why is Mobile-First Annual Report Design Malaysia’s New Standard?
Mobile-first annual report design is rapidly becoming the new standard in Malaysia because a significant majority of stakeholders, particularly younger investors and employees, access information primarily via their smartphones. Optimizing for mobile ensures maximum reach and a superior user experience, reflecting the pervasive nature of mobile technology in daily life. This approach prioritizes the smallest screen first, then scales up.
According to the Malaysian Communications and Multimedia Commission (MCMC), mobile internet penetration in Malaysia reached 98.2% in 2025. This statistic alone underscores why annual report design in KL must prioritize mobile. A report that is clunky or difficult to navigate on a smartphone will alienate a large segment of its audience. Mobile-first design focuses on clean layouts, touch-friendly interfaces, and efficient loading times, making complex information digestible on smaller screens. Companies that fail to adapt risk being perceived as outdated or out of touch with modern communication preferences, potentially impacting investor confidence and talent acquisition efforts.
The Impact of Interactive Reports on Stakeholder Engagement and Transparency
Interactive annual reports significantly elevate stakeholder engagement and transparency by making corporate information more accessible, understandable, and appealing. This shift fosters a deeper connection between the company and its audience, moving beyond mere compliance to genuine communication. When information is easy to find and interact with, stakeholders are more likely to spend time understanding a company’s performance and vision.
For investors, interactive reports offer unprecedented transparency. They can quickly access specific financial metrics, compare performance across years with dynamic charts, and understand the context behind figures through embedded explanations. This level of detail, presented in an engaging format, helps build trust and confidence. For employees, an interactive report can serve as a powerful internal communication tool, reinforcing company values and future direction. A 2025 study by the Malaysian Investor Relations Association (MIRA) indicated that companies employing interactive annual reports reported a 28% increase in positive feedback from institutional investors regarding data clarity and accessibility.
Comparing Traditional vs. Interactive Annual Reports
The distinction between traditional and interactive annual reports is stark, particularly in their impact on engagement and information retention. While traditional reports serve a foundational purpose, interactive versions are designed for the modern digital consumer, offering a richer and more dynamic experience.
| Feature | Traditional Annual Report (PDF) | Interactive Digital Annual Report |
|---|---|---|
| Format | Static PDF, print-ready | Dynamic web platform, responsive design |
| Engagement | Passive reading, often overwhelming | Active interaction, exploration, high retention |
| Data Presentation | Static charts, tables, text-heavy | Interactive charts, infographics, video, audio |
| Accessibility | Can be difficult on mobile, limited search | Mobile-first, advanced search, WCAG compliance |
| Updates | Requires re-publication of entire document | Real-time updates possible for certain sections |
| Analytics | Limited insight into reader behavior | Detailed analytics on views, clicks, time spent |
| Cost Efficiency | Printing, distribution costs (if physical) | Higher initial design, lower distribution costs |
| Environmental Impact | Potential paper waste (if printed) | Significantly lower carbon footprint |
This comparison clearly illustrates why the investment in sophisticated compelling annual report design in Malaysia is a strategic imperative. The interactive format not only meets contemporary stakeholder demands but also provides companies with valuable insights into content performance through analytics, a capability entirely absent in static PDFs.
The Role of Annual Report Design Agencies in KL
Annual report design agencies in Kuala Lumpur are playing a pivotal role in this digital transformation, acting as strategic partners that blend creative vision with technical expertise. These agencies are not merely graphic designers; they are architects of digital experiences, helping companies translate complex corporate narratives into engaging, interactive platforms. Their specialized skills are crucial for navigating the intricacies of digital reporting.
These agencies bring expertise in user experience (UX) design, data visualization, web development, and content strategy. They understand how to structure information for digital consumption, ensuring intuitive navigation and compelling storytelling. For example, many agencies now offer workshops to help corporate communication teams understand the nuances of writing for interactive reports, focusing on concise, scannable content that complements visual elements. The demand for their services has surged, with some top-tier agencies in KL reporting a 60% increase in inquiries for interactive annual report projects over the past 12 months, according to an industry brief by the Malaysian Design Council.
Choosing the Right Partner for Your 2026 Annual Report
Selecting the right annual report design partner is critical for ensuring a successful and impactful 2026 report. Companies should look beyond basic design capabilities and seek agencies that demonstrate a deep understanding of digital strategy, stakeholder engagement, and the specific regulatory landscape in Malaysia. The right partner will be an extension of your communications team, not just a vendor.
Key considerations when choosing an agency include their portfolio of interactive projects, their technical capabilities (e.g., expertise in HTML5, JavaScript frameworks, data visualization tools), their approach to UX/UI design, and their ability to integrate with existing corporate systems. Furthermore, evaluate their understanding of ESG reporting requirements and their capacity to handle sensitive financial data securely. A proven track record with other Malaysian public-listed companies (PLCs) is often a strong indicator of reliability and sector-specific knowledge. Datanex advises companies to conduct thorough due diligence, including reference checks and detailed project proposals, to ensure alignment with their strategic communication goals.
Frequently Asked Questions
What is an interactive annual report?
An interactive annual report is a digital corporate publication designed to be highly engaging and user-friendly, typically hosted on a dedicated website or web application. It incorporates multimedia elements, dynamic data visualizations, and intuitive navigation, allowing stakeholders to explore corporate information in a non-linear, personalized manner.
Why are Malaysian companies moving to interactive annual reports now?
Malaysian companies are shifting to interactive annual reports to meet evolving stakeholder expectations for transparency and engagement, improve information retention, and leverage digital platforms for more effective communication. The move is also driven by the desire to stand out in a competitive market and enhance brand perception.
What are the benefits of an interactive annual report for investors?
For investors, interactive annual reports offer easier access to specific financial data, the ability to compare performance trends through dynamic charts, and a more comprehensive understanding of a company’s strategy and ESG initiatives. This enhanced clarity and accessibility can lead to more informed investment decisions and increased trust.
Is an interactive annual report more expensive than a traditional PDF?
While the initial development cost for a fully interactive annual report can be higher due to specialized design and technical requirements, it often results in long-term cost savings by eliminating printing and physical distribution expenses. The enhanced engagement and analytical insights also provide a significant return on investment.
How does interactive annual report design in KL address mobile users?
Annual report design agencies in KL prioritize mobile-first design, ensuring that interactive reports are fully responsive and optimized for viewing and interaction on smartphones and tablets. This includes touch-friendly navigation, optimized content layouts, and fast loading times to cater to Malaysia’s high mobile internet penetration.
Can interactive annual reports be updated after publication?
Yes, one significant advantage of interactive digital annual reports is the ability to make real-time updates to certain sections, such as news announcements, investor presentations, or sustainability progress, without having to re-publish the entire document. This ensures stakeholders always have access to the most current information.
What role does data visualization play in these new reports?
Data visualization is crucial in interactive annual reports as it transforms complex financial and operational data into easily understandable visual formats. Interactive charts, graphs, and infographics allow users to explore data dynamically, identify trends, and grasp key insights much faster than reading through dense tables or text.
The Future is Interactive for Annual Report Design in Malaysia
The shift towards interactive annual report design in Malaysia is more than a fleeting trend; it’s a fundamental evolution in corporate communication. As we head further into 2026, companies that embrace this digital transformation will not only meet regulatory obligations but also forge stronger, more meaningful connections with their stakeholders. The era of static reporting is over. The future is dynamic, engaging, and undeniably interactive, setting a new benchmark for annual report design in KL and across the nation.
Datanex advises companies to prepare for the new disclosure rules by focusing on innovative approaches for clarity in their reporting, especially concerning ESG data. This will be crucial for the upcoming digital interactivity for Q1 2026 reporting.
Last updated: June 13, 2026