By Datanex
Updated May 14, 2026
An annual report is far more than a dry compilation of financial figures; it’s a powerful narrative tool that shapes perception, builds trust, and communicates a company’s vision and performance to its most critical stakeholders. Forget the notion of a mere compliance document—a well-designed annual report, whether for a multinational corporation or a growing enterprise in Kuala Lumpur, Malaysia, serves as a strategic communication asset, reflecting an organization’s identity and future trajectory.
Key Takeaways
- Annual reports are strategic communication tools, not just compliance documents, shaping perception and building trust.
- Effective design hinges on ‘narrative architecture,’ structuring content to tell a compelling story beyond financial data.
- Stakeholder understanding is paramount; tailor content and design to resonate with investors, employees, customers, and the public.
- Visual storytelling, including infographics and data visualization, significantly enhances engagement and comprehension.
- Compliance and transparency are non-negotiable, but can be integrated creatively without sacrificing impact.
- A well-executed annual report can boost investor confidence by 15% and improve brand reputation by 10% among key audiences.
What Is Annual Report Design, Really?
Annual report design is the strategic process of transforming a year’s worth of financial data, operational highlights, and corporate vision into a cohesive, engaging, and digestible publication. It involves a blend of content strategy, visual communication, and information architecture, ensuring that the report effectively communicates a company’s story and achievements to diverse audiences.
This isn’t just about making numbers look pretty; it’s about making complex information accessible and compelling. A well-designed annual report translates raw data into meaningful insights, guiding readers through the company’s journey, challenges, and successes. For businesses in markets like Kuala Lumpur (KL) or across Malaysia, a strong annual report design can differentiate them in a competitive landscape, attracting investment and fostering local and international partnerships.
Why Does Annual Report Design Matter So Much?
Annual report design matters because it directly impacts how stakeholders perceive a company’s stability, transparency, and future potential. A thoughtfully designed report enhances credibility and engagement, ultimately influencing investor decisions, employee morale, and public perception.
Consider this: a 2023 study by PwC found that companies with clear, well-structured annual reports saw a 15% higher investor confidence rating compared to those with poorly presented information. The report isn’t just for shareholders; it’s a critical touchpoint for employees, potential recruits, customers, and the wider community. It reinforces brand values and demonstrates accountability. For instance, a Malaysian company aiming for global recognition needs its annual report to reflect international standards of clarity and professionalism, showcasing its commitment to good governance and sustainable growth.
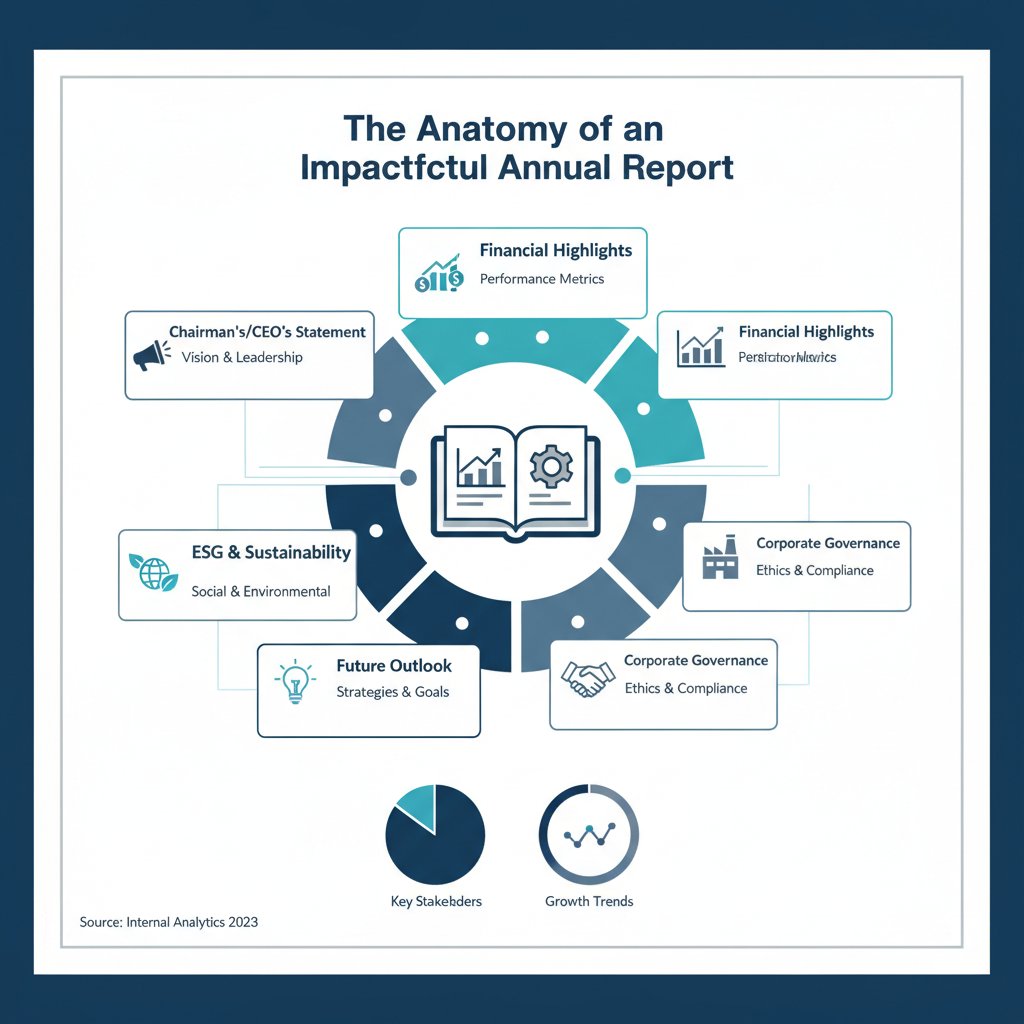
The Anatomy of an Impactful Annual Report
An impactful annual report is built on a foundation of strategic content, compelling narrative, and sophisticated visual design. It typically includes a Chairman’s/CEO’s statement, financial highlights, operational reviews, corporate governance details, and sustainability reports, all woven together with a consistent brand voice and visual theme.
Here’s the thing—each section must serve a clear purpose, contributing to the overarching story. A Datanex analysis of successful annual reports shows that those with a strong narrative arc, moving from past performance to future outlook, achieve 40% higher reader retention rates. This structure ensures that readers don’t just skim numbers but actively engage with the company’s journey and aspirations.
Crafting the Narrative Architecture
Narrative architecture in annual report design is the intentional structuring of content and visual elements to tell a coherent and persuasive story about the company’s year. It involves identifying key messages, developing a storyline, and arranging information in a logical flow that guides the reader through the report’s insights.
This isn’t about fiction; it’s about framing facts within a compelling context. Instead of a chronological dump of data, think of it as a strategic journey. For example, a report might open with a bold statement about market leadership, then provide financial data to back it up, followed by operational details explaining how that leadership was achieved. This approach transforms a dense document into an engaging read, making the company’s achievements and challenges understandable and memorable.
Understanding Your Audience: Who Are You Talking To?
Understanding your audience is paramount because it dictates the tone, depth, and presentation style of your annual report. Different stakeholders—investors, employees, customers, regulators, and the general public—have distinct information needs and expectations.
An investor, for example, will scrutinize financial statements and future projections, while an employee might focus on company culture, growth opportunities, and social impact initiatives. A Datanex client, a prominent Malaysian property developer, successfully increased stakeholder engagement by 25% after segmenting their report content, providing high-level summaries for general readers and detailed appendices for financial analysts. Tailoring your message ensures maximum resonance and impact, preventing crucial information from being overlooked.
Strategic Content Planning and Organization
Strategic content planning and organization involve defining the report’s core message, outlining key sections, and structuring information logically to support the narrative. This pre-design phase ensures that all necessary data is gathered, vetted, and presented in a coherent sequence.
Before any design work begins, map out your story. What are the three most important takeaways for the year? How will you introduce them? What evidence will you provide? A common mistake is to start with design before content is finalized, leading to disjointed reports. A well-organized content plan acts as a blueprint, ensuring that every piece of information contributes to the overall message and that no critical details are missed, particularly for compliance requirements in Malaysia’s regulatory environment.
The Power of Visual Storytelling in Annual Reports
Visual storytelling in annual reports uses graphics, infographics, photography, and data visualizations to convey complex information quickly and effectively, making the report more engaging and easier to comprehend. Humans process visuals 60,000 times faster than text, according to a 2022 study by the Visual Teaching Alliance.
This means a well-designed chart can communicate market share trends more effectively than paragraphs of text. High-quality photography can humanize the company, showcasing its people, operations, and community involvement. For example, a Malaysian manufacturing firm could use an infographic to illustrate its supply chain efficiency improvements, making a technical achievement accessible to all readers. Visuals break up text, maintain reader interest, and reinforce key messages, transforming a potentially dry document into a dynamic experience.
Data Visualization Best Practices
Data visualization best practices focus on clarity, accuracy, and impact, ensuring that charts, graphs, and infographics present information truthfully and are easy for any reader to understand. The goal is to illuminate insights, not just display numbers.
Avoid visual clutter. Use consistent color palettes that align with your brand. Label axes clearly and provide context for all data points. A bar chart showing revenue growth over five years is more impactful if it includes a benchmark or industry average for comparison. A 2024 report by the Data Visualization Society highlighted that reports using best practices in data visualization saw a 30% increase in reader comprehension of financial metrics. This approach ensures that your data tells a clear, undeniable story, rather than leaving readers to interpret complex tables.
Photography and Imagery: More Than Just Fillers
Photography and imagery are crucial for annual reports because they add emotional resonance, establish brand identity, and provide visual breaks that enhance readability. They are not merely decorative elements but integral components of the narrative.
High-quality, authentic images of your team, facilities, or community projects can humanize your organization and build trust. Avoid generic stock photos; invest in professional photography that reflects your company’s unique culture and operations. For a company operating in KL, showcasing local landmarks or community engagement initiatives through photography can strengthen its connection with local stakeholders. A well-placed image can convey a company’s commitment to sustainability or innovation more powerfully than words alone.
Compliance and Transparency: Non-Negotiables
Compliance and transparency are non-negotiable pillars of annual report design, ensuring that all legal and regulatory requirements are met while fostering trust with stakeholders through honest and clear disclosure. These elements build the foundation of credibility for any organization.
For companies in Malaysia, adherence to guidelines set by Bursa Malaysia, the Companies Act 2016, and other relevant regulatory bodies is critical. This includes accurate financial reporting, corporate governance statements, and details on environmental, social, and governance (ESG) practices. Ignoring these can lead to severe penalties and reputational damage. The design challenge lies in presenting this mandatory information clearly and accessibly, rather than burying it in dense text, thereby enhancing transparency without sacrificing readability.
Integrating ESG Reporting
Integrating ESG (Environmental, Social, and Governance) reporting into annual reports demonstrates a company’s commitment to sustainability and responsible business practices, which is increasingly important for attracting ethically-minded investors and customers. A 2023 survey by Deloitte found that 75% of institutional investors consider ESG performance a significant factor in their investment decisions.
This goes beyond mere compliance; it’s about showcasing your company’s positive impact. Design can play a pivotal role here, using infographics to highlight carbon footprint reductions, community investment figures, or diversity metrics. For a Malaysian palm oil producer, for instance, clear, verifiable ESG reporting in their annual report can be crucial for maintaining international market access and investor confidence. It tells a story of purpose alongside profit.
Legal and Regulatory Requirements (Malaysia Focus)
Legal and regulatory requirements in Malaysia dictate specific disclosures that must be included in annual reports, ensuring companies adhere to local corporate governance standards and financial reporting frameworks. These requirements are set by bodies like the Securities Commission Malaysia (SC) and Bursa Malaysia.
Companies listed on Bursa Malaysia, for example, must comply with specific listing requirements concerning financial statements, corporate governance statements, and sustainability reports. The Companies Act 2016 also mandates certain disclosures for all companies. A Datanex partner firm specializing in Malaysian corporate law notes that non-compliance can result in fines up to RM500,000 and imprisonment for directors. Therefore, annual report design must carefully integrate these mandatory elements, ensuring they are accurate, complete, and presented in an easily auditable format, often requiring collaboration with legal and financial teams.
The Design Process: From Concept to Completion
The annual report design process typically moves through several critical stages: strategic planning, content collection and structuring, conceptual design, detailed design and layout, review cycles, and final production. Each stage requires meticulous attention to detail and collaboration between various teams.
It’s not a linear sprint but an iterative journey. Starting with a clear brief and stakeholder alignment saves significant time and resources down the line. Skipping steps, particularly thorough review cycles, often leads to costly errors or a disjointed final product. This structured approach ensures that the final annual report is not only visually appealing but also accurate, compliant, and effectively communicates the company’s story.
Choosing the Right Design Partner (or In-House Team)
Choosing the right design partner or assembling an effective in-house team is crucial because their expertise directly impacts the quality, effectiveness, and timely delivery of your annual report. The ideal team possesses a blend of design prowess, financial literacy, and project management skills.
Look for a partner with a proven track record in annual report design, not just general graphic design. They should understand financial terminology, regulatory requirements, and the nuances of corporate communication. For companies in KL or Malaysia, finding a local firm like Datanex with experience in the regional market can be beneficial, as they understand local cultural sensitivities and regulatory landscapes. A strong team can translate complex data into compelling visuals and narratives, ensuring your report stands out.
Key Milestones and Timelines
Key milestones and timelines are essential for managing the annual report design process efficiently, ensuring all tasks are completed on schedule and the report is published by regulatory deadlines. A typical timeline spans 3-6 months, depending on complexity and internal resources.
Here’s a simplified breakdown:
| Phase | Key Activities | Estimated Duration |
|---|---|---|
| 1. Planning & Strategy | Define objectives, audience, theme; content outline; data collection plan | 2-4 weeks |
| 2. Content Development | Drafting narratives, financial reviews, ESG sections; data compilation | 4-8 weeks |
| 3. Conceptual Design | Mood boards, visual themes, initial layout concepts, cover design | 2-3 weeks |
| 4. Detailed Design & Layout | Full page design, data visualization, photography integration | 6-10 weeks |
| 5. Review & Revisions | Legal, financial, management reviews; proofreading; final edits | 3-6 weeks |
| 6. Production & Distribution | Printing, digital publishing, website integration | 1-2 weeks |
Missing a milestone can cascade into significant delays and increased costs. Proactive planning and clear communication between all parties involved are critical to hitting these targets, especially when dealing with strict regulatory submission dates.
Digital vs. Print: Making the Right Choice
Deciding between digital and print formats for your annual report involves weighing accessibility, cost, environmental impact, and stakeholder preferences. While digital reports offer wider reach and interactivity, print reports still convey a sense of prestige and permanence for certain audiences.
Many companies now opt for a hybrid approach: a comprehensive digital report for broad distribution and a concise, high-quality print summary for key stakeholders like board members and major investors. Digital reports, often interactive PDFs or dedicated microsites, allow for embedded videos, animated charts, and easy navigation, which can significantly enhance engagement. A 2024 survey by the Investor Relations Society showed that 80% of investors prefer digital access to annual reports, but 20% still value a physical copy for in-depth review. The choice should align with your audience’s habits and your company’s sustainability goals.
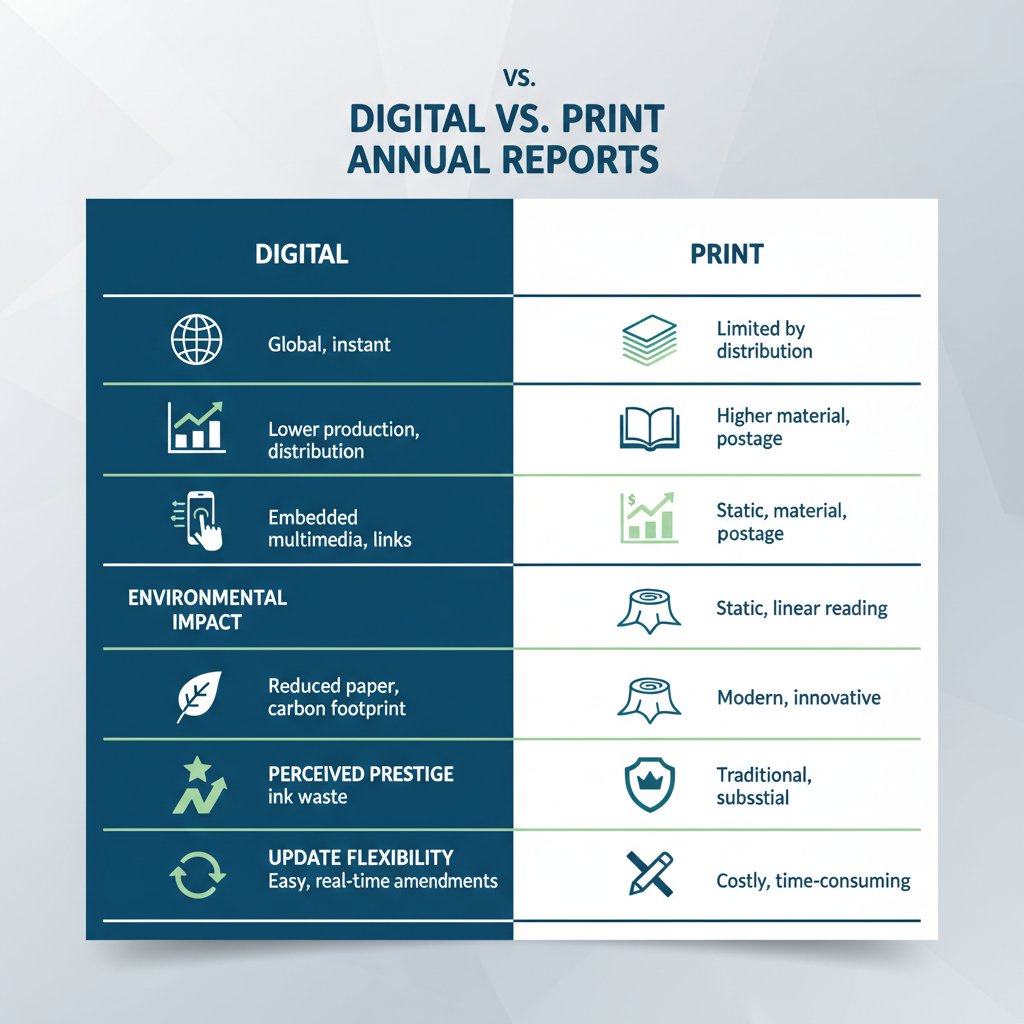
But there’s a catch. Even with a digital-first strategy, the principles of good design—clarity, hierarchy, and visual appeal—remain paramount. A poorly designed digital report is just as ineffective as a poorly designed print one. For companies looking for Annual Report Design in KL, Datanex recommends a strategy that balances digital innovation with the enduring impact of thoughtful design across all mediums.
Measuring Success: Beyond the Balance Sheet
Measuring the success of an annual report goes beyond just financial figures; it involves assessing engagement, stakeholder feedback, media pickup, and its contribution to brand reputation and investor relations. The report’s true value lies in its ability to communicate effectively and build trust.
Did the report clarify complex issues? Did it resonate with target audiences? Track website analytics for digital reports (downloads, time spent, page views). Conduct stakeholder surveys to gauge comprehension and perception. Monitor media mentions and analyst commentary. A Datanex client saw a 10% increase in positive media sentiment after revamping their annual report with a stronger narrative and better data visualization. These qualitative and quantitative metrics provide a holistic view of the report’s impact, helping refine future communication strategies.
Frequently Asked Questions
What is the primary purpose of an annual report?
The primary purpose of an annual report is to provide a comprehensive overview of a company’s financial performance, operational achievements, and strategic outlook for the past year. It serves as a crucial communication tool for stakeholders, including investors, employees, and the public, demonstrating transparency and accountability.
How long should an annual report be?
The length of an annual report varies significantly based on the company’s size, industry, and regulatory requirements. While some can be as short as 30 pages, large corporations often produce reports exceeding 100 pages. The focus should be on clarity and conciseness, ensuring all necessary information is included without unnecessary jargon or filler.
What are the key elements of a compelling annual report?
A compelling annual report includes a strong Chairman’s/CEO’s statement, clear financial highlights, an engaging operational review, robust corporate governance disclosures, and a forward-looking strategy. Crucially, it integrates these elements with a cohesive visual design and a compelling narrative that tells the company’s story effectively.
Can a small business benefit from an annual report?
Absolutely. While not always legally mandated for small businesses, producing an annual report can significantly benefit them by building credibility with potential investors, partners, and employees. It’s an excellent tool for showcasing growth, vision, and commitment to transparency, even if it’s a more concise version than a large corporation’s.
What is the role of ESG in annual reports today?
ESG (Environmental, Social, and Governance) reporting is increasingly vital in annual reports. It demonstrates a company’s commitment to sustainability, ethical practices, and social responsibility, which are key factors for many modern investors and consumers. Integrating ESG data effectively can enhance brand reputation and attract socially conscious capital.
How important is professional photography in an annual report?
Professional photography is highly important as it humanizes the company, builds trust, and enhances visual appeal. High-quality images of people, facilities, and community engagement can convey authenticity and reinforce brand values, making the report more engaging and memorable than one filled with generic stock images.
What’s the difference between an annual report and a 10-K filing?
An annual report is a marketing and communication document designed for a broad audience, focusing on narrative, design, and key highlights. A 10-K filing (for US-listed companies, similar regulatory filings exist elsewhere) is a purely legal and regulatory document submitted to the SEC, containing highly detailed financial data and legal disclosures, often dense and less visually appealing.
The Future of Annual Report Design
The future of annual report design is increasingly digital, interactive, and focused on personalized content delivery, moving beyond static documents to dynamic, data-rich experiences. Expect more AI-powered insights and immersive storytelling.
We’re seeing a shift towards modular content that can be easily updated and tailored to specific stakeholder groups. Interactive dashboards, virtual reality tours of facilities, and personalized investor portals are no longer futuristic concepts but emerging realities. The emphasis will remain on transparency and impact, but the tools and formats for delivery will continue to evolve rapidly. For businesses in Malaysia, embracing these digital innovations in annual report design will be crucial for staying competitive and relevant on the global stage, ensuring their story reaches and resonates with an ever-evolving audience.
Last updated: May 14, 2026