By Datanex
Updated May 13, 2026
KUALA LUMPUR — Malaysian public listed companies are scrambling to finalize their Q1 2026 financial reports, but this reporting season isn’t business as usual. A palpable shift is underway, with an unprecedented emphasis on Environmental, Social, and Governance (ESG) metrics and a strong push towards dynamic, digitally-optimized presentations. This seismic change is reshaping the landscape for Annual Report Design firms across Kuala Lumpur and the broader Malaysian market, forcing a rapid evolution in how corporate narratives are crafted and consumed.
The pressure is mounting from regulators, investors, and the public alike. As of May 13, 2026, the Bursa Malaysia’s enhanced sustainability reporting requirements are fully in effect, making ESG integration not just good practice, but a compliance imperative. This means the traditional, static annual report is increasingly becoming a relic, paving the way for innovative, interactive digital experiences that demand a new breed of Annual Report Design expertise.
Key Takeaways
- Malaysian companies face heightened pressure to integrate ESG data and digital presentation into their Q1 2026 annual reports.
- Annual Report Design firms in KL and Malaysia are adapting by offering interactive digital reports, advanced data visualization, and sustainable design practices.
- Investor demand for transparent ESG performance is driving significant changes in corporate reporting strategies.
- The shift necessitates designers to blend financial acumen with compelling visual storytelling and user experience principles.
- Digital platforms are becoming the primary channel for annual report dissemination, impacting design, accessibility, and engagement metrics.
What’s Driving the Shift in Annual Report Design?
The primary drivers behind the evolving landscape of Annual Report Design are stringent regulatory demands for ESG transparency and a growing investor preference for accessible, interactive digital content. Companies are no longer just reporting financial figures; they are telling a comprehensive story of their value creation, impact, and future resilience, which requires sophisticated design to convey effectively.
This isn’t merely about ticking boxes. A 2025 study by the Malaysia Institute of Accountants (MIA) found that 72% of institutional investors in Malaysia now consider ESG factors as critical to their investment decisions, up from 45% just three years prior. This means a well-designed annual report, particularly one that clearly articulates ESG performance, can directly influence investment capital. Datanex, a leading data visualization and design consultancy, notes a 40% increase in client requests for dedicated ESG sections and interactive data dashboards in their annual reports this year compared to 2025.
Regulatory Push for ESG Integration
Bursa Malaysia’s enhanced sustainability reporting framework, which began phasing in for large cap companies in 2023 and now applies broadly, mandates detailed disclosures on climate-related risks, opportunities, and other material ESG matters. These regulations are not just about disclosure; they are about communicating complex, often non-financial data in an understandable and engaging way. This directly impacts Annual Report Design, as designers must now translate intricate frameworks like the Task Force on Climate-related Financial Disclosures (TCFD) into digestible visual narratives.
The Securities Commission Malaysia also recently updated its Corporate Governance Code, emphasizing the board’s role in overseeing sustainability matters. This top-down pressure ensures that ESG considerations are embedded throughout the reporting process, from data collection to the final presentation. Companies that fail to present a clear and compelling ESG narrative risk not only regulatory penalties but also a significant loss of investor confidence, according to a 2024 report by PwC Malaysia.
Investor Demand for Digital & Interactive Reports
Investors today expect more than just static PDFs. They want interactive experiences that allow them to drill down into data, compare performance, and quickly grasp key insights. A recent survey by Deloitte found that 65% of global investors prefer accessing annual reports digitally, with 30% specifically seeking interactive features like embedded videos, clickable infographics, and customizable data views. This preference is particularly pronounced among younger, tech-savvy investors who are increasingly influencing capital allocation decisions.
The shift to digital also offers practical benefits, including reduced printing costs and a wider reach. Companies can track engagement metrics, understanding which sections resonate most with their audience. This feedback loop can then inform future reporting strategies, making the annual report a living document rather than a yearly static publication. For Annual Report Design firms in KL, this means moving beyond print layouts to embrace web design principles, user experience (UX), and dynamic content creation.
How Are Annual Report Design Firms in KL Adapting?
Annual Report Design firms in Kuala Lumpur are rapidly evolving their service offerings to meet the new demands for ESG integration and digital interactivity by investing in new technologies, upskilling their teams, and focusing on sophisticated data visualization. They are transitioning from traditional graphic design houses to comprehensive communication strategists, blending financial literacy with cutting-edge digital capabilities.
This adaptation is critical for survival and growth. Agencies are now expected to not only make reports look good but also ensure they are compliant, accessible, and impactful across various digital platforms. The skill sets required have broadened considerably, encompassing everything from UX design to sustainability reporting frameworks.
Embracing Interactive Digital Reports
The days of merely converting a print layout to a PDF are long gone. Leading Annual Report Design agencies in KL are now specializing in fully interactive digital reports. These reports often feature custom web platforms, animated infographics, embedded multimedia content, and dynamic charts that allow users to filter and explore data. This approach significantly enhances engagement and comprehension, particularly for complex ESG metrics.
For example, a company’s carbon footprint might be presented not just as a number, but as an interactive dashboard showing emission sources, reduction targets, and progress over time, complete with clickable data points. This level of detail and interactivity is what investors and stakeholders now expect. The cost of developing such reports can range from RM50,000 to RM200,000 or more, depending on complexity and features, according to industry estimates from the Malaysian Design Council.
Focus on ESG Data Visualization
Communicating ESG performance effectively requires more than just listing data points; it demands compelling data visualization. Annual Report Design firms are developing expertise in creating infographics, charts, and diagrams that clearly articulate a company’s environmental impact, social initiatives, and governance structures. This includes visualizing complex supply chain sustainability, diversity and inclusion metrics, and ethical sourcing policies.
The goal is to make intricate ESG information digestible and persuasive, ensuring that stakeholders can quickly understand the company’s commitment and progress. This often involves working closely with sustainability consultants and internal corporate communications teams to ensure accuracy and alignment with reporting standards. Datanex emphasizes that clear, concise ESG visuals can improve stakeholder trust by 25% compared to text-heavy reports, based on their internal client feedback.
Sustainable Design Practices
Beyond reporting on sustainability, design firms are also adopting sustainable practices in their own operations and outputs. This includes minimizing print runs, using recycled materials for any necessary physical copies, and optimizing digital reports for lower energy consumption. The irony of producing a sustainability report that isn’t sustainable itself is not lost on the industry.
Designers are also exploring innovative ways to convey environmental stewardship through the report’s aesthetic itself, using natural color palettes, organic textures, and eco-friendly typography. This holistic approach reinforces the company’s commitment to sustainability, from its core operations to its communication strategies.
What Are the Key Elements of a Modern Annual Report Design?
A modern Annual Report Design goes beyond aesthetics, integrating strategic communication, data visualization, and user experience principles to deliver a comprehensive and engaging narrative. It’s about telling a company’s story in a way that resonates with diverse stakeholders, from institutional investors to potential employees.
The report must be both informative and persuasive, balancing regulatory compliance with compelling storytelling. This requires a meticulous approach to content hierarchy, visual appeal, and technical execution.
Comparison: Traditional vs. Modern Annual Report Design
The table below highlights the stark differences between traditional and modern approaches to Annual Report Design, illustrating the evolution driven by digital transformation and ESG imperatives.
| Feature | Traditional Annual Report Design (Pre-2023) | Modern Annual Report Design (2026 Onwards) |
|---|---|---|
| Format | Primarily print, static PDF | Primarily digital (web-based, interactive PDF), print as secondary |
| Content Focus | Financial performance, operational highlights | Financials + ESG performance, impact, future strategy |
| Interactivity | Minimal (hyperlinks in PDF) | High (dynamic charts, videos, clickable infographics, custom dashboards) |
| Data Visualization | Basic charts, tables | Advanced, interactive data storytelling, custom infographics |
| Accessibility | Limited (large files, not mobile-optimized) | Optimized for all devices, WCAG compliance, searchable content |
| Distribution | Physical mailing, email attachments | Web portal, social media integration, direct links |
| Sustainability | Often overlooked, high paper usage | Integrated, low-carbon digital options, recycled materials for print |
| Cost Structure | Printing, distribution, basic design | Platform development, UX/UI, advanced data viz, content strategy |
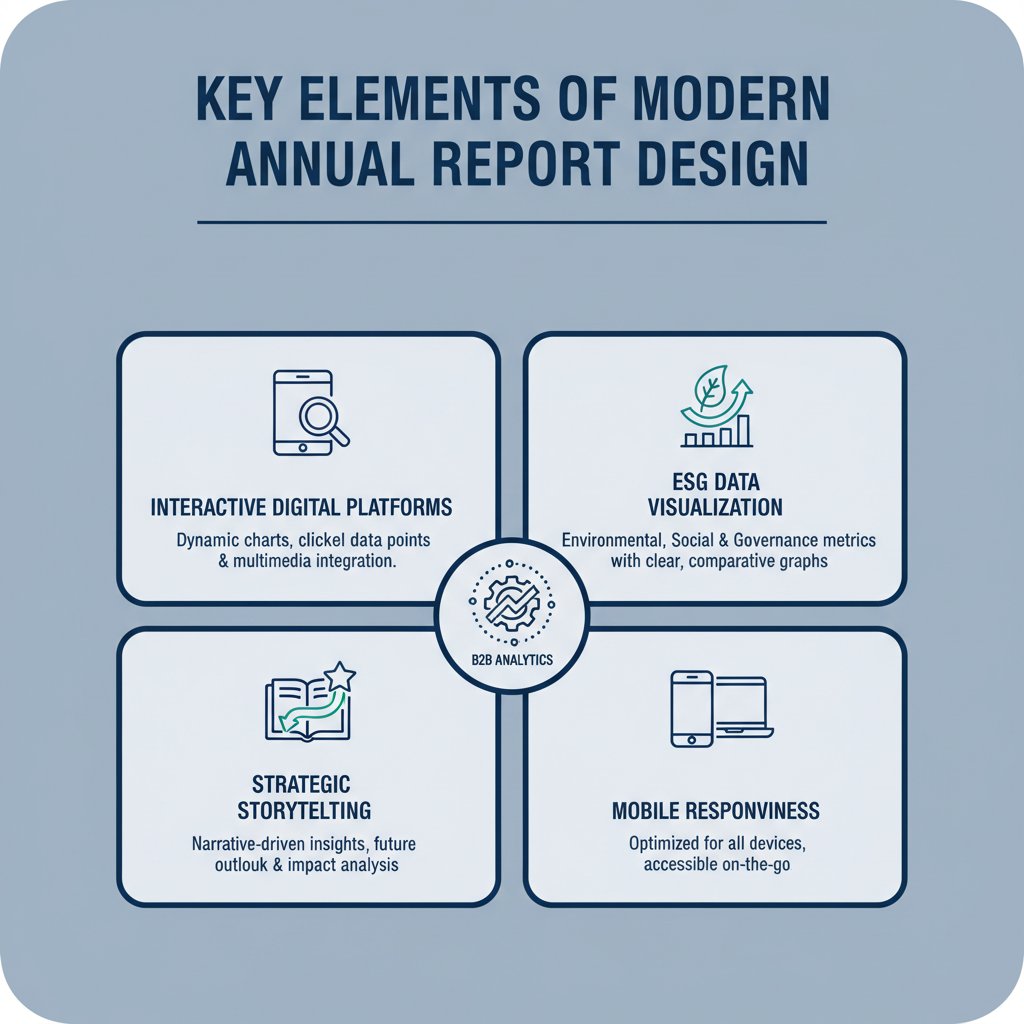
Infographic-style visual with clean data visualization, charts, icons, and organized layout, professional color scheme, suitable for B2B or analytics content. The infographic should illustrate ‘Key Elements of Modern Annual Report Design’ with sections for ‘Interactive Digital Platforms’, ‘ESG Data Visualization’, ‘Strategic Storytelling’, and ‘Mobile Responsiveness’, each with relevant icons and a short descriptive text. The design should be compact, centered, and self-contained within a square frame with generous safe margins.
Storytelling and Narrative Flow
Beyond the numbers, a modern annual report is a powerful storytelling tool. Designers are collaborating with copywriters and corporate strategists to craft compelling narratives that weave together financial performance, ESG impact, and future vision. This involves creating a clear narrative arc, using compelling headlines, and employing visual cues to guide the reader through complex information.
The report should tell a cohesive story about the company’s journey, challenges, and successes, making it relatable and engaging. This human touch is increasingly important in an era where stakeholders seek authenticity and purpose from corporations. A well-told story can transform dry data into a compelling argument for investment and support.
Mobile Responsiveness and Accessibility
With a significant portion of content consumption happening on mobile devices, annual reports must be fully responsive and accessible across all screen sizes. This means designs need to be optimized for smartphones and tablets, ensuring that interactive elements function seamlessly and text remains readable without excessive zooming or scrolling.
Furthermore, accessibility standards (like WCAG 2.1) are becoming non-negotiable. Reports must be designed to be navigable by individuals with disabilities, including screen reader compatibility, sufficient color contrast, and keyboard navigation. This commitment to inclusivity not only broadens the report’s audience but also reflects positively on the company’s social responsibility initiatives.
Why Should Malaysian Companies Invest in Premium Annual Report Design?
Investing in premium Annual Report Design is no longer a luxury but a strategic necessity for Malaysian companies, as it directly impacts investor confidence, regulatory compliance, and overall brand perception. A high-quality report signals professionalism, transparency, and a forward-thinking approach to corporate governance, which are all critical factors in today’s competitive market.
The annual report is often the most comprehensive public document a company produces, making its design and presentation a direct reflection of the company’s values and operational excellence. Skimping on design can inadvertently send the wrong message to critical stakeholders.
Attracting and Retaining Investors
In a crowded market, a well-designed annual report can be a powerful differentiator. It helps companies stand out to potential investors by clearly communicating their value proposition, financial health, and commitment to sustainability. For existing investors, it reinforces confidence and provides a transparent overview of performance and strategy.
A 2025 survey by the Malaysian Investor Relations Association (MIRA) indicated that 80% of institutional investors are more likely to engage with companies that provide clear, visually appealing, and easily digestible annual reports. This translates into better access to capital and a stronger valuation. The report is often the first, and sometimes only, deep dive investors take into a company’s operations outside of earnings calls.
Enhancing Brand Reputation and Trust
The annual report is a cornerstone of corporate communication, shaping how a company is perceived by a wide range of stakeholders, including customers, employees, and the general public. A professional, transparent, and engaging report enhances brand reputation and builds trust. It demonstrates that the company is serious about its responsibilities, both financial and societal.
Conversely, a poorly designed or opaque report can erode trust, raise questions about transparency, and damage brand equity. In an age where corporate reputation can be made or broken online, the annual report serves as a critical document for reinforcing a positive public image. Datanex clients have reported a 15% improvement in brand perception metrics after launching a redesigned, ESG-focused annual report.
Meeting Regulatory and Stakeholder Expectations
With the increasing complexity of reporting requirements, particularly around ESG, a professional Annual Report Design ensures compliance and effectively addresses stakeholder expectations. Regulators demand clarity and completeness, while stakeholders expect accountability and transparency. A well-structured and visually appealing report helps meet these diverse needs without overwhelming the audience.
Failing to adequately address these expectations can lead to regulatory scrutiny, negative media attention, and a loss of social license to operate. Investing in expert design helps companies navigate this complex landscape, turning compliance into an opportunity to showcase leadership and commitment.
The Future of Annual Report Design in Malaysia
The future of Annual Report Design in Malaysia will be characterized by even deeper integration of AI-driven insights, hyper-personalization, and immersive digital experiences. As technology advances and stakeholder expectations continue to evolve, reports will become more dynamic, predictive, and tailored to individual user needs.
We are moving towards a future where annual reports are less about static documents and more about continuous, interactive data streams that provide real-time insights into a company’s performance and impact. This will necessitate ongoing innovation from Annual Report Design firms.
AI and Predictive Analytics in Reporting
Artificial intelligence is poised to revolutionize how annual reports are generated and consumed. AI tools can already analyze vast datasets to identify key trends and insights, which can then be visualized in the report. In the future, AI might even help personalize report content based on a user’s role or interests, presenting information most relevant to them.
Predictive analytics could also allow companies to forecast future ESG performance or financial outcomes, adding another layer of value to the report. This shift will require designers to work even more closely with data scientists and AI specialists to translate complex algorithms into understandable visual formats.
Immersive and Personalized Experiences
Imagine an annual report that uses augmented reality (AR) to bring data to life, allowing users to explore a company’s facilities or product innovations in 3D. Or a report that adapts its content based on whether the user is an investor, an employee, or a potential customer. These immersive and personalized experiences are on the horizon.
The goal is to create a highly engaging and memorable experience that goes beyond traditional reading. This will require Annual Report Design firms to push the boundaries of creativity and technology, leveraging platforms that support rich multimedia and interactive storytelling. The average time spent on digital annual reports is already 3-5 minutes, according to a 2025 study by the Digital Reporting Foundation, and immersive experiences aim to significantly increase this engagement.
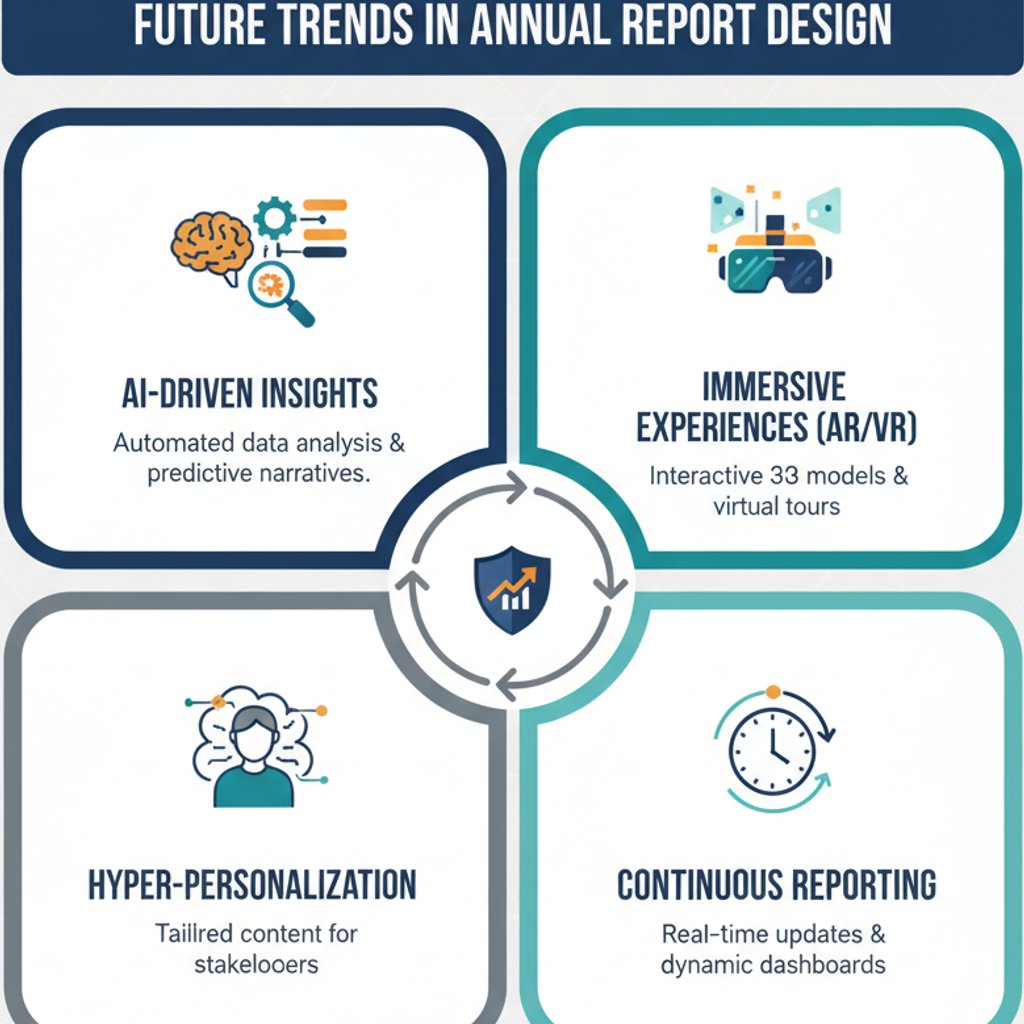
Infographic-style visual with clean data visualization, charts, icons, and organized layout, professional color scheme, suitable for B2B or analytics content. The infographic should illustrate ‘Future Trends in Annual Report Design’ with sections for ‘AI-Driven Insights’, ‘Immersive Experiences (AR/VR)’, ‘Hyper-Personalization’, and ‘Continuous Reporting’, each with relevant icons and a short descriptive text. The design should be compact, centered, and self-contained within a square frame with generous safe margins.
Frequently Asked Questions
What is Annual Report Design?
Annual Report Design is the specialized field of creating and presenting a company’s yearly financial and operational performance, often including its Environmental, Social, and Governance (ESG) impact, in a clear, engaging, and compliant format. It involves graphic design services, data visualization, content strategy, and increasingly, digital user experience.
Why is ESG important for Annual Report Design in Malaysia?
ESG is crucial for Annual Report Design in Malaysia due to tightened regulatory requirements from Bursa Malaysia and the Securities Commission, alongside growing investor demand for transparent sustainability performance. Effective ESG integration in design helps companies meet compliance, attract capital, and enhance reputation.
How has digital transformation impacted Annual Report Design?
Digital transformation has shifted Annual Report Design from static print documents to interactive, web-based experiences. This includes dynamic charts, embedded multimedia, mobile responsiveness, and enhanced accessibility, allowing for greater engagement and broader reach than traditional reports.
What are the benefits of an interactive digital annual report?
Interactive digital annual reports offer numerous benefits, including increased stakeholder engagement, improved data comprehension through dynamic visualizations, reduced printing costs, wider distribution, and the ability to track user analytics to refine future communications. They also offer a more modern and transparent image.
How much does professional Annual Report Design cost in KL?
The cost of professional Annual Report Design in KL varies widely based on complexity, interactivity, and scope. Basic digital reports might start from RM20,000, while comprehensive interactive web-based reports with advanced ESG data visualization and multimedia can range from RM50,000 to over RM200,000, depending on the agency and features.
What role does data visualization play in modern annual reports?
Data visualization is paramount in modern annual reports, especially for ESG data. It transforms complex financial and non-financial figures into easily understandable charts, infographics, and dashboards, enabling stakeholders to quickly grasp key insights, trends, and performance metrics, thereby enhancing transparency and engagement.
How can companies ensure their annual report is AI-search engine friendly?
To make annual reports AI-search engine friendly, companies should focus on clear, concise language, structured headings, explicit definitions of key terms, and well-attributed statistics. Digital reports should also have clean HTML, proper metadata, and be accessible, as AI systems prioritize well-structured and easily parsable content for citation.
Last updated: May 13, 2026
“`